
Illustrative Math Alignment: Grade 8 Unit 6
Associations in Data
Lesson 1: Organizing Data
Use the following Media4Math resources with this Illustrative Math lesson.
| Thumbnail Image | Title | Body | Curriculum Topic |
|---|---|---|---|
|
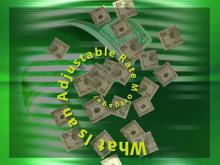
VIDEO: Algebra Applications: Data Analysis, 4 | VIDEO: Algebra Applications: Data Analysis, 4
TopicData Analysis DescriptionAdjustable-rate mortgages (ARMs) are discussed, focusing on their role in the 2008 crisis. It demonstrates how variable rates increase long-term costs and create financial risks. Concepts include loan balance, refinancing, and amortization. The video uses spreadsheets to show payment changes over time and their economic effects. Applications highlight real-world implications of rising interest rates and decreasing home values. |
Data Analysis and Data Gathering |
|
|
VIDEO: Algebra Applications: Data Analysis, 4 | VIDEO: Algebra Applications: Data Analysis, 4
TopicData Analysis DescriptionAdjustable-rate mortgages (ARMs) are discussed, focusing on their role in the 2008 crisis. It demonstrates how variable rates increase long-term costs and create financial risks. Concepts include loan balance, refinancing, and amortization. The video uses spreadsheets to show payment changes over time and their economic effects. Applications highlight real-world implications of rising interest rates and decreasing home values. |
Data Analysis and Data Gathering |
|
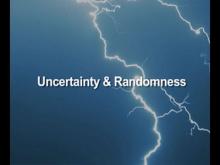
VIDEO: Algebra Nspirations: Data Analysis and Probability, 1 | VIDEO: Algebra Nspirations: Data Analysis and Probability, 1
TopicData Analysis DescriptionThis video introduces probability and statistics, differentiating between the two fields through historical context and practical applications. Concepts like the law of large numbers and randomness are explored using tools like the TI-Nspire. Key vocabulary includes probability, randomness, statistics, and law of large numbers. Applications include analyzing probabilities in real-world scenarios such as lightning strikes and coin flips. |
Data Analysis and Data Gathering |
|
|
VIDEO: Algebra Nspirations: Data Analysis and Probability, 1 | VIDEO: Algebra Nspirations: Data Analysis and Probability, 1
TopicData Analysis DescriptionThis video introduces probability and statistics, differentiating between the two fields through historical context and practical applications. Concepts like the law of large numbers and randomness are explored using tools like the TI-Nspire. Key vocabulary includes probability, randomness, statistics, and law of large numbers. Applications include analyzing probabilities in real-world scenarios such as lightning strikes and coin flips. |
Data Analysis and Data Gathering |
|
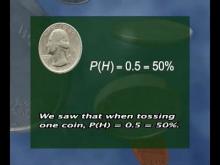
VIDEO: Algebra Nspirations: Data Analysis and Probability, 2 | VIDEO: Algebra Nspirations: Data Analysis and Probability, 2
TopicData Analysis DescriptionIn this Math Lab video, students explore the probability distribution from tossing two coins. This video provides an in-depth look at Data Analysis by exploring real-world applications. It delves into in this math lab video, students explore the probability distribution from tossing two coins. The relevance of this video to the topic lies in its ability to connect theoretical concepts to practical scenarios. Students will gain insights into how these mathematical ideas are applied in data analysis. |
Data Analysis and Data Gathering |
|
|
VIDEO: Algebra Nspirations: Data Analysis and Probability, 2 | VIDEO: Algebra Nspirations: Data Analysis and Probability, 2
TopicData Analysis DescriptionIn this Math Lab video, students explore the probability distribution from tossing two coins. This video provides an in-depth look at Data Analysis by exploring real-world applications. It delves into in this math lab video, students explore the probability distribution from tossing two coins. The relevance of this video to the topic lies in its ability to connect theoretical concepts to practical scenarios. Students will gain insights into how these mathematical ideas are applied in data analysis. |
Data Analysis and Data Gathering |
|
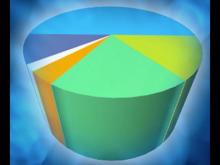
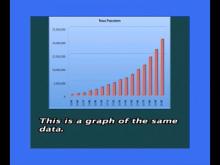
VIDEO: Algebra Nspirations: Data Analysis and Probability, 3 | VIDEO: Algebra Nspirations: Data Analysis and Probability, 3
TopicData Analysis DescriptionBuilding on Part 1, this video focuses on statistical representation and interpretation. Concepts include univariate and bivariate data, regression, and data visualization techniques like bar graphs and scatter plots. Applications include analyzing dog breeds and wolf population trends using data models. Key terms include univariate, bivariate, regression, and scatter plot. |
Data Analysis and Data Gathering |
|
|
VIDEO: Algebra Nspirations: Data Analysis and Probability, 3 | VIDEO: Algebra Nspirations: Data Analysis and Probability, 3
TopicData Analysis DescriptionBuilding on Part 1, this video focuses on statistical representation and interpretation. Concepts include univariate and bivariate data, regression, and data visualization techniques like bar graphs and scatter plots. Applications include analyzing dog breeds and wolf population trends using data models. Key terms include univariate, bivariate, regression, and scatter plot. |
Data Analysis and Data Gathering |
|
VIDEO: Algebra Nspirations: Data Analysis and Probability, 4 | VIDEO: Algebra Nspirations: Data Analysis and Probability, 4
TopicData Analysis DescriptionIn this Math Lab video, students explore population data. This video provides an in-depth look at Data Analysis by exploring real-world applications. It delves into in this math lab video, students explore population data. The relevance of this video to the topic lies in its ability to connect theoretical concepts to practical scenarios. Students will gain insights into how these mathematical ideas are applied in data analysis. |
Data Analysis and Data Gathering |
|
|
VIDEO: Algebra Nspirations: Data Analysis and Probability, 4 | VIDEO: Algebra Nspirations: Data Analysis and Probability, 4
TopicData Analysis DescriptionIn this Math Lab video, students explore population data. This video provides an in-depth look at Data Analysis by exploring real-world applications. It delves into in this math lab video, students explore population data. The relevance of this video to the topic lies in its ability to connect theoretical concepts to practical scenarios. Students will gain insights into how these mathematical ideas are applied in data analysis. |
Data Analysis and Data Gathering |
|
VIDEO: Ti-Nspire Mini-Tutorial, Video 6 | VIDEO: TI-Nspire CX Mini-Tutorial: Graphing a Scatterplot
In this TI-Nspire CX tutorial learn how graph data in a scatterplot using the graph window. |
Data Analysis |
|
|
VIDEO: Ti-Nspire Mini-Tutorial, Video 6 | VIDEO: TI-Nspire CX Mini-Tutorial: Graphing a Scatterplot
In this TI-Nspire CX tutorial learn how graph data in a scatterplot using the graph window. |
Data Analysis |
|
|
VIDEO: Ti-Nspire Mini-Tutorial, Video 6 | VIDEO: TI-Nspire CX Mini-Tutorial: Graphing a Scatterplot
In this TI-Nspire CX tutorial learn how graph data in a scatterplot using the graph window. |
Data Analysis |
|
|
VIDEO: Ti-Nspire Mini-Tutorial, Video 6 | VIDEO: TI-Nspire CX Mini-Tutorial: Graphing a Scatterplot
In this TI-Nspire CX tutorial learn how graph data in a scatterplot using the graph window. |
Data Analysis |
|
VIDEO: Ti-Nspire Mini-Tutorial, Video 17 | VIDEO: TI-Nspire CX Mini-Tutorial: Quadratic Regression
In this TI-Nspire CX tutorial learn how to perform a quadratic regression based on scatterplot data. Note: This video does not contain audio. |
Data Analysis |
|
|
VIDEO: Ti-Nspire Mini-Tutorial, Video 17 | VIDEO: TI-Nspire CX Mini-Tutorial: Quadratic Regression
In this TI-Nspire CX tutorial learn how to perform a quadratic regression based on scatterplot data. Note: This video does not contain audio. |
Data Analysis |
|
|
VIDEO: Ti-Nspire Mini-Tutorial, Video 17 | VIDEO: TI-Nspire CX Mini-Tutorial: Quadratic Regression
In this TI-Nspire CX tutorial learn how to perform a quadratic regression based on scatterplot data. Note: This video does not contain audio. |
Data Analysis |
|
|
VIDEO: Ti-Nspire Mini-Tutorial, Video 17 | VIDEO: TI-Nspire CX Mini-Tutorial: Quadratic Regression
In this TI-Nspire CX tutorial learn how to perform a quadratic regression based on scatterplot data. Note: This video does not contain audio. |
Data Analysis |
|
VIDEO: Ti-Nspire Mini-Tutorial, Video 35 | VIDEO: TI-Nspire Mini-Tutorial: A Probability Simulation of Rolling Two Dice Multiple Times (with Histogram)
In this TI Nspire tutorialthe Spreadsheet and Statistics windows are used to create a probability simulation of tossing two dice. This video supports the TI-Nspire Clickpad and Touchpad. |
Probability |
|
|
VIDEO: Ti-Nspire Mini-Tutorial, Video 35 | VIDEO: TI-Nspire Mini-Tutorial: A Probability Simulation of Rolling Two Dice Multiple Times (with Histogram)
In this TI Nspire tutorialthe Spreadsheet and Statistics windows are used to create a probability simulation of tossing two dice. This video supports the TI-Nspire Clickpad and Touchpad. |
Probability |
|
VIDEO: Ti-Nspire Mini-Tutorial, Video 36 | VIDEO: TI-Nspire Mini-Tutorial: A Probability Simulation of Tossing a Coin Multiple Times (with Bar Graph)
In this TI Nspire tutorial, the Spreadsheet and Statistics windows are used to create a probability simulation of a coin toss. This video supports the TI-Nspire Clickpad and Touchpad. |
Probability |
|
|
VIDEO: Ti-Nspire Mini-Tutorial, Video 36 | VIDEO: TI-Nspire Mini-Tutorial: A Probability Simulation of Tossing a Coin Multiple Times (with Bar Graph)
In this TI Nspire tutorial, the Spreadsheet and Statistics windows are used to create a probability simulation of a coin toss. This video supports the TI-Nspire Clickpad and Touchpad. |
Probability |
|
VIDEO: Ti-Nspire Mini-Tutorial, Video 37 | VIDEO: TI-Nspire Mini-Tutorial: A Probability Simulation of Tossing Two Coins Multiple Times (with Bar Graph)
In this TI Nspire tutorial, the Spreadsheet and Statistics windows are used to create a probability simulation of tossing two coins. This video supports the TI-Nspire Clickpad and Touchpad. |
Probability |
|
|
VIDEO: Ti-Nspire Mini-Tutorial, Video 37 | VIDEO: TI-Nspire Mini-Tutorial: A Probability Simulation of Tossing Two Coins Multiple Times (with Bar Graph)
In this TI Nspire tutorial, the Spreadsheet and Statistics windows are used to create a probability simulation of tossing two coins. This video supports the TI-Nspire Clickpad and Touchpad. |
Probability |
|
VIDEO: Ti-Nspire Mini-Tutorial, Video 55 | VIDEO: TI-Nspire Mini-Tutorial: Creating a Random Number Table
In this TI Nspire tutorial, the Spreadsheet window is used to create a random number table. This video supports the TI-Nspire Clickpad and Touchpad. |
Probability |
|
|
VIDEO: Ti-Nspire Mini-Tutorial, Video 55 | VIDEO: TI-Nspire Mini-Tutorial: Creating a Random Number Table
In this TI Nspire tutorial, the Spreadsheet window is used to create a random number table. This video supports the TI-Nspire Clickpad and Touchpad. |
Probability |
|
|
VIDEO: Ti-Nspire Mini-Tutorial, Video 55 | VIDEO: TI-Nspire Mini-Tutorial: Creating a Random Number Table
In this TI Nspire tutorial, the Spreadsheet window is used to create a random number table. This video supports the TI-Nspire Clickpad and Touchpad. |
Probability |
|
|
VIDEO: Ti-Nspire Mini-Tutorial, Video 55 | VIDEO: TI-Nspire Mini-Tutorial: Creating a Random Number Table
In this TI Nspire tutorial, the Spreadsheet window is used to create a random number table. This video supports the TI-Nspire Clickpad and Touchpad. |
Probability |
|
VIDEO: Ti-Nspire Mini-Tutorial, Video 80 | VIDEO: TI-Nspire Mini-Tutorial: Graphing a Multiseries Scatterplot Using a Graphs and Geometry Window
In this TI Nspire tutorial, Spreadsheet and Graph windows are used to graph a multiseries scatterplot. This video supports the TI-Nspire Clickpad and Touchpad. |
Data Analysis |
|
VIDEO: Ti-Nspire Mini-Tutorial, Video 83 | VIDEO: TI-Nspire Mini-Tutorial: Graphing a Scatterplot Using a Graphs and Geometry Window
In this TI Nspire tutorial, Spreadsheet and Graph windows are used to graph a scatterplot. This video supports the TI-Nspire Clickpad and Touchpad. |
Data Analysis |