 Lesson Plan: Graphing Linear Equations
Lesson Objectives:
- Graph linear equations using various methods
- Use slope-intercept form
- Use x and y intercepts
- Interpret slope and y-intercept in real-world contexts
Florida BEST Standards:
- MA.8.AR.2.1: Recognize slope and y-intercept in y = mx + b; interpret in real-world context.
- MA.8.AR.2.3: Determine slope from table, graph, or description.
- MA.8.AR.3.2: Write equation in slope-intercept form from table, graph, or description.
- MA.8.AR.3.4: Determine and interpret rate of change as slope.
- MA.8.AR.3.5: Solve real-world problems with linear equations in two variables.
- MA.8.F.1.1: Determine if a relation is a function; identify domain and range.
- MA.8.F.1.2: Determine if a function is linear from graph, equation, or table.
Prerequisite Skills:
- Plotting points on the coordinate plane
- Understanding of slope and y-intercept concepts
Key Vocabulary:
- Coordinate plane
- Ordered pair
- Slope
- y-intercept
- Slope-intercept form
Warm-up Activity (5 minutes)
For students that need to review graphing points on the coordinate plane review the first example from this video:
https://www.media4math.com/library/39514/asset-preview
Engage students by asking them to plot the following points on a coordinate plane:
(1, 2)
(2, 4)
(3, 6).
Use this Desmos activity to graph the points and ask students to notice any patterns.
https://www.desmos.com/calculator/cq834lfyfp
Then ask them to find additional coordinates that continue the pattern.
Teach (20 minutes)
Definitions
Use the following video definitions to define key terms:
- The slope-intercept form of a linear equation: https://www.media4math.com/library/74604/asset-preview
- The y-intercept: https://www.media4math.com/library/74608/asset-preview
- The slope: https://www.media4math.com/library/74617/asset-preview
Examples
Demonstrate how to identify the slope and y-intercept from a given linear equation.
- Start by showing this video about the slope-intercept form:
https://www.media4math.com/library/39543/asset-preview - Provide examples of graphing linear equations using the slope-intercept form. Use this slide show, which focuses on given the slope and the y-intercept, graph the linear equation
https://www.media4math.com/library/slideshow/math-examples-slope-intercept-form - Have students use this Desmos activity to explore the slope-intercept form:
https://www.media4math.com/library/40088/asset-preview - Here is the corresponding worksheet for this Desmos activity:
https://www.media4math.com/library/40089/asset-preview
Review (10 minutes)
- Try this drag-and-drop game, which focuses on linear equations:
https://www.media4math.com/library/4829/asset-preview - Encourage students to graph linear equations using the slope-intercept form.
- Address any misconceptions or questions that arise during the review.
Assess (10 minutes)
Administer a 10-question quiz to assess students' understanding of graphing linear equations. The quiz should include questions on plotting points, identifying slope and y-intercept, graphing linear equations, and interpreting slope and y-intercept in real-life situations.
Quiz
- Plot the points (1, 2), (-2, -1), and (3, 4) on the coordinate plane.
- Identify the slope and y-intercept of the equation y = 2x + 3.
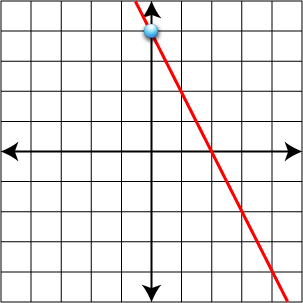
- Graph the equation y = -1/2x + 4 on the coordinate plane.
- If the slope of a linear equation is 3 and the y-intercept is -2, what is the equation?
- Interpret the meaning of the slope and y-intercept in the equation y = 0.5x + 10. You save fifty cents a day in a piggy bank that already has an amount of money in it.
- A line passes through the origin and through (4, 9). What is its equation?
- Determine if the point (3, -1) lies on the line represented by the equation y = 2x - 5.
- Graph the equation 3y = 6x - 9 on the coordinate plane.
- Explain the relationship between the slope of a line and its steepness.
- This equation represents a car slowing down every second at a constant speed (in miles per hour): y = -5x +50. What is the car's initial speed? What does the slope represent?
Answer Key

- Slope = 2, y-intercept = 3
- y = 3x - 2
- The slope represents the 50 cents saved a day. The y-intercept is the amount of money initially in the piggy bank (\$10).
- y = 9/4x
- No, the point (3, -1) does not lie on the line.
- The steeper the line, the greater the slope value (positive or negative).
- Initial speed is 50 mph. The car slows down by 5 mph every second.
![]() Purchase the lesson plan bundle. Click here.
Purchase the lesson plan bundle. Click here.