 Lesson Plan: Linear Functions and Applications
Lesson Objectives
- Understand and represent linear functions
- Identify domain and range
- Apply linear functions to real-world problems
- Use multiple representations (equations, tables, graphs)
Florida BEST Standards
- MA.8.F.1.1: Determine if a relation is a function; identify domain and range.
- MA.8.F.1.2: Determine if a function is linear from graph, equation, or table.
- MA.8.AR.2.1: Recognize slope and y-intercept in y = mx + b; interpret in real-world context.
- MA.8.AR.3.1: Determine if a linear relationship is proportional.
- MA.8.AR.3.2: Write equation in slope-intercept form from table, graph, or description.
- MA.8.AR.3.3: Determine if a linear function fits a real-world context.
- MA.8.AR.3.4: Determine and interpret rate of change as slope.
- MA.8.AR.3.5: Solve real-world problems with linear equations in two variables.
Prerequisite Skills
- Understanding of linear equations
- Graphing linear equations
- Interpreting slope and y-intercept
Key Vocabulary
- Function
- Linear function
- Domain
- Range
- Input
- Output
Warm-up Activity (5 minutes)
Ask students to identify patterns in a set of ordered pairs, such as
(1, 3)
(2, 5)
(3, 7)
(4, 9)
Guide them to recognize that the y-values increase by 2 for each increase of 1 in the x-values, representing a linear relationship.
Use this Desmos activity to graph these ordered pairs. Ask students to predict the next two sets of ordered pairs. Have them make a conclusion about the graph.
https://www.desmos.com/calculator/nqqzl2dkc6
Teach (20 minutes)
Definitions
Define a function as a rule that assigns to each input exactly one output. Use the following slide show:
https://www.media4math.com/library/slideshow/function-representations
The slide show introduces linear functions as a specific type of function where the output (y-value) changes at a constant rate as the input (x-value) changes.
- Explain the equation y = mx + b, where m represents the slope (rate of change) and b represents the y-intercept.
Use this slide show to go over the key ideas around graphs of linear functions:
https://www.media4math.com/library/slideshow/graphs-linear-functions
Demonstrate how to represent linear functions using equations, tables, and graphs. Use this slide show:
https://www.media4math.com/library/slideshow/multiple-representations-linear-equations
Discuss the domain and range of linear functions, emphasizing that the domain is the set of all possible input values, and the range is the set of all possible output values. Use this slide show of definitions:
https://www.media4math.com/library/slideshow/function-definitions
Examples
Provide examples and non-examples of linear functions to reinforce understanding. Use this slide show to demonstrate non-linear function graphs:
https://www.media4math.com/library/slideshow/non-linear-function-graphs
Use this slide show to look at examples of finding the domain and range of a function:
https://www.media4math.com/library/slideshow/domain-and-range-functions-linear
Applications
The following are slide shows that go into detailed analysis of applications of linear functions. Choose one of these slide shows to show an application of linear functions:
Review (10 minutes)
- Engage students in a discussion by asking them to identify real-world situations that can be modeled using linear functions.
- Provide a few examples, such as calculating the cost of renting a car based on a daily rate and a one-time fee, or determining the distance traveled based on a constant speed.
- Use one of the applications of linear functions shown in the previous section to review another application.
- Encourage students to share their own examples and explain how they would represent the situation using a linear function.
Assess (10 minutes)
Administer a 10-question quiz to assess students' understanding of linear functions and their applications. The quiz questions and answers are provided separately.
Quiz
- Which of the following is true about a function?
a) An input value can have more than one output value.
b) An input value has one output value.
c) Two input values can have the same output value.
d) An input value cannot be zero.
- Define a linear function.
- What does the slope (m) represent in the equation y = mx + b?
- If a linear function has a slope of 3 and a y-intercept of 2, what is the equation of the function?
- Given the ordered pairs (0, 2), (1, 4), (2, 6), (3, 8), identify the linear function represented by these points.
- What is the domain of the linear function y = 2x - 3?
- What is the range of the linear function y = -x + 5?
- Represent the linear function y = 4x - 1 using a table of values.
- Graph the linear function y = -2x + 3.
- A car rental company charges \$25 per day plus a one-time fee of \$15. Write a linear function to represent the total cost of renting the car for x days.
Answer Key
- b) and c)
- A linear function is of the form y = mx + b, whose graph is a line.
- The slope (m) represents the rate of change or the constant rate at which the output changes for each unit change in the input.
- y = 3x + 2
- y = 2x + 2
- The domain is the set of all real numbers.
- The range is the set of all real numbers.
- x | y
0 | -1
1 | 3
2 | 7
3 | 11 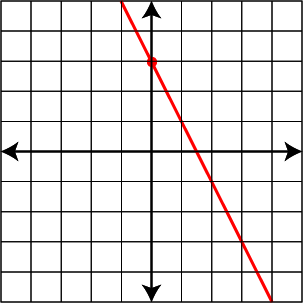
- Total cost = 25x + 15
![]() Purchase the lesson plan bundle. Click here.
Purchase the lesson plan bundle. Click here.