 Lesson Plan: Analyzing and Comparing Linear Relationships, Including Parallel and Perpendicular Lines
Lesson Summary
In this lesson, students will explore the properties of parallel and perpendicular lines and their relationships in coordinate geometry. They will learn how to identify these lines based on their slopes, write equations of parallel and perpendicular lines, and apply these concepts in real-world problem-solving scenarios.
Students will practice:
- Identifying parallel and perpendicular lines from equations, graphs, and tables.
- Understanding the slope criteria for parallel (\( m_1 = m_2 \)) and perpendicular lines (\( m_1 \times m_2 = -1 \)).
- Writing equations of parallel and perpendicular lines given a point and a reference line.
- Graphing parallel and perpendicular lines on a coordinate plane.
- Applying parallel and perpendicular line properties in geometric and algebraic contexts.
By the end of this lesson, students will have a strong foundation in analyzing linear relationships and using slope to determine the relationships between lines.
Lesson Objectives
This lesson can be completed in one 50-minute class period. However, for a more in-depth exploration of the concepts, especially the real-world applications and group activities, it may be beneficial to extend it to two class periods.
- Compare properties of two functions represented in different ways
- Interpret the meaning of slope and y-intercept in context
- Use linear functions to model real-world situations
- Understand and apply the relationships between slopes of parallel and perpendicular lines
Common Core Standards
- CCSS.MATH.CONTENT.8.F.B.4 Construct a function to model a linear relationship between two quantities. Determine the rate of change and initial value of the function from a description of a relationship or from two (x, y) values, including reading these from a table or from a graph. Interpret the rate of change and initial value of a linear function in terms of the situation it models, and in terms of its graph or a table of values.
- CCSS.MATH.CONTENT.8.F.B.5 Describe qualitatively the functional relationship between two quantities by analyzing a graph (e.g., where the function is increasing or decreasing, linear or nonlinear). Sketch a graph that exhibits the qualitative features of a function that has been described verbally.
- CCSS.MATH.CONTENT.8.EE.B.6 Use similar triangles to explain why the slope m is the same between any two distinct points on a non-vertical line in the coordinate plane; derive the equation y = mx for a line through the origin and the equation y = mx + b for a line intercepting the vertical axis at b.
Prerequisite Skills
- Understanding of linear equations
- Graphing linear functions
- Basic knowledge of slope
Key Vocabulary
- Parallel Lines: Two lines in the same plane that never intersect and have the same slope.
- Perpendicular Lines: Two lines that intersect at a 90-degree angle. Their slopes are negative reciprocals of each other.
- Slope: The measure of the steepness of a line, represented as \( m \) in the equation \( y = mx + b \).
- Negative Reciprocal: The opposite inverse of a number. If \( m_1 \) is the slope of one line, the slope of a perpendicular line is \( m_2 = -\frac{1}{m_1} \).
- Y-Intercept: The point where a line crosses the y-axis, given by \( b \) in the equation \( y = mx + b \).
- Equation of a Line: The linear equation \( y = mx + b \) represents a straight line, where \( m \) is the slope and \( b \) is the y-intercept.
- Coordinate Plane: A two-dimensional system where points are plotted using an x-axis (horizontal) and a y-axis (vertical).
- Point-Slope Form: The equation of a line given a point and a slope, expressed as \( y - y_1 = m(x - x_1) \).
- Slope-Intercept Form: The equation of a line written as \( y = mx + b \), where \( m \) is the slope and \( b \) is the y-intercept.
- Transversal: A line that crosses two or more lines, often used in geometric proofs involving parallel and perpendicular lines.
Multimedia Resources
- A collection of definitions on the topic of ratios, proportions, and percents: https://www.media4math.com/Definitions--RatiosProportionsPercents
- A student tutorial slide show on definitions on the topic of ratios, proportions, and percents: https://www.media4math.com/library/slideshow/student-tutorial-ratios-proportions-and-percents-definitions
Warm Up Activities
Choose from one or more activities.
Activity 1: Review of Graphs of Linear Functions
Present the following scenarios to students and ask them to sketch possible graphs and discuss their reasoning:
- Two cars are traveling at the same speed. One car leaves at time t = 0 and the other one leaves several minutes later. What might the distance-vs-time graphs look like?
- What would need to change in scenario 1 so that the second car catches up to the first car?
Show the following graphs. One of them represents two cars traveling at the same speed and the other represents cars traveling at different speeds, with one car catching up with the other.
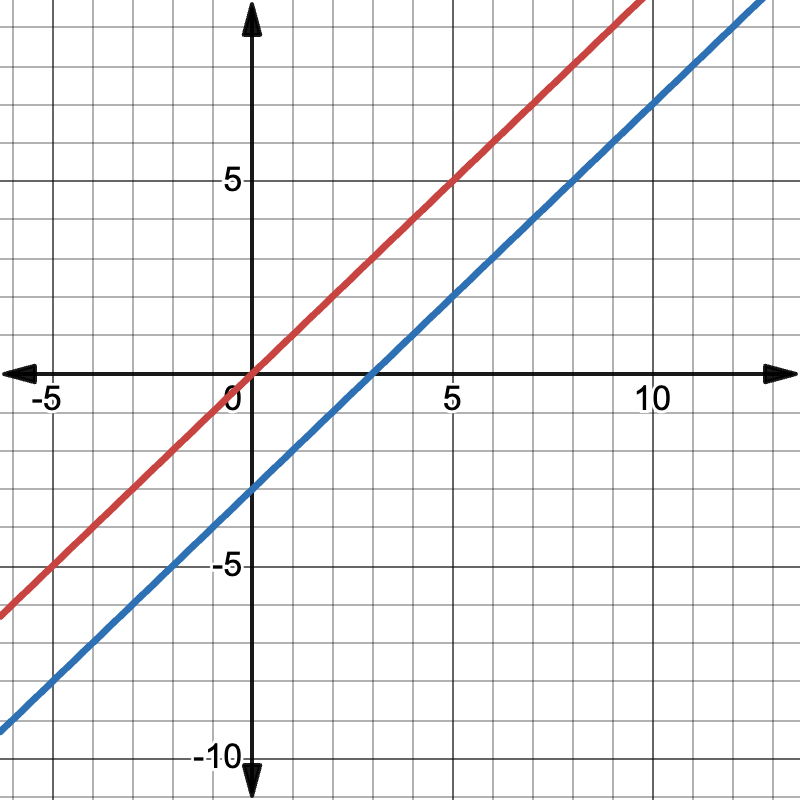 | 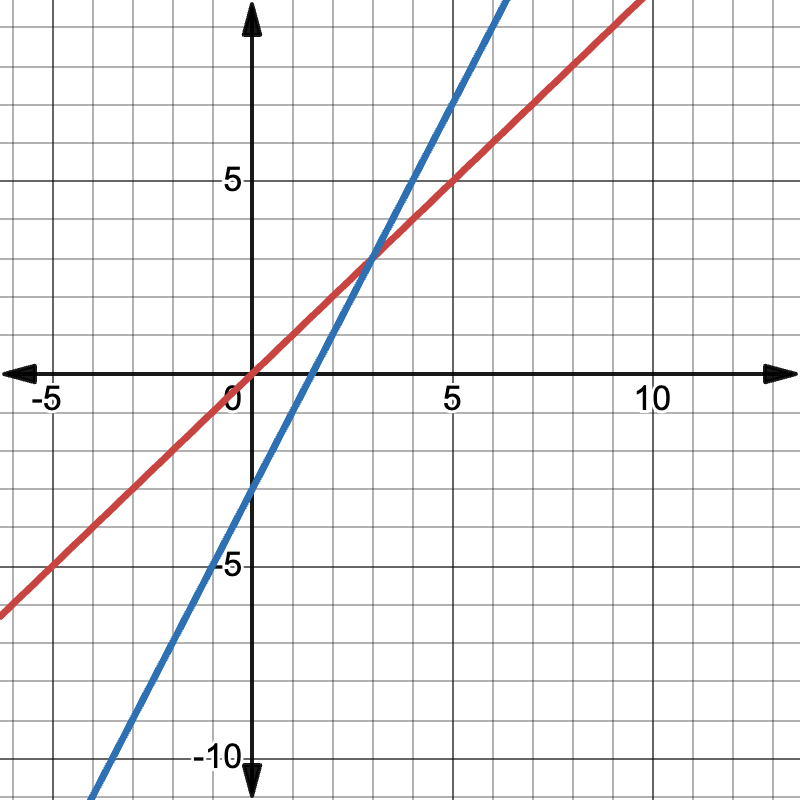 |
Discuss student responses, emphasizing that in scenario 1, the graphs would be parallel lines (same slope, different y-intercepts), while in scenario 2, the second car would need to travel at a faster speed (steeper slope) to catch up.
Activity 2: Review of Parallel Lines
Parallel lines have the same slope and never intersect.
Key Property: If two lines are parallel, their slopes are equal: \[ m_1 = m_2 \]
Example: Determine if the lines represented by the equations \( y = 2x + 5 \) and \( y = 2x - 3 \) are parallel.
Solution:
- Both equations are in slope-intercept form \( y = mx + b \).
- The slope of the first line is \( m_1 = 2 \).
- The slope of the second line is \( m_2 = 2 \).
- Since \( m_1 = m_2 \), the lines are parallel.
Encourage students to think of real-world examples of parallel lines, such as railroad tracks or the edges of a notebook.
Activity 3: Review of Perpendicular Lines
Perpendicular lines intersect at a 90-degree angle, and their slopes are negative reciprocals.
Key Property: If two lines are perpendicular, their slopes satisfy the equation: \[ m_1 \times m_2 = -1 \]
Example: Determine if the lines represented by the equations \( y = 3x + 4 \) and \( y = -\frac{1}{3}x - 2 \) are perpendicular.
Solution:
- The slope of the first line is \( m_1 = 3 \).
- The slope of the second line is \( m_2 = -\frac{1}{3} \).
- Check if their product equals -1: \[ 3 \times -\frac{1}{3} = -1 \]
- Since the equation holds true, the lines are perpendicular.
Ask students to identify perpendicular lines in their environment, such as street intersections or the corner of a picture frame.
Teach
Understanding Parallel Lines
Parallel lines have the same slope and never intersect.
Key Property: If two lines are parallel, their slopes are equal: \[ m_1 = m_2 \]
Example: Are the lines represented by \( y = 4x + 2 \) and \( y = 4x - 5 \) parallel?
Solution:
- The slope of the first line is \( m_1 = 4 \).
- The slope of the second line is \( m_2 = 4 \).
- Since \( m_1 = m_2 \), the lines are parallel.
Understanding Perpendicular Lines
Perpendicular lines intersect at a 90-degree angle, and their slopes are negative reciprocals of each other.
Key Property: If two lines are perpendicular, their slopes satisfy the equation: \[ m_1 \times m_2 = -1 \]
Example: Are the lines represented by \( y = -\frac{2}{5}x + 3 \) and \( y = \frac{5}{2}x - 1 \) perpendicular?
Solution:
- The slope of the first line is \( m_1 = -\frac{2}{5} \).
- The slope of the second line is \( m_2 = \frac{5}{2} \).
- Check if their product equals -1: \[ -\frac{2}{5} \times \frac{5}{2} = -1 \]
- Since the equation holds true, the lines are perpendicular.
Writing Equations of Parallel Lines
To write an equation of a line parallel to a given line, follow these steps:
- Identify the slope of the given line.
- Use the same slope for the new line.
- Use point-slope form \( y - y_1 = m(x - x_1) \) if a point is given.
Example: Write the equation of a line parallel to \( y = 3x - 4 \) that passes through (2,5).
Solution:
- The given line has a slope of \( m = 3 \).
- Using point-slope form: \[ y - 5 = 3(x - 2) \]
- Simplify: \[ y - 5 = 3x - 6 \] \[ y = 3x - 1 \]
Thus, the equation of the parallel line is \( y = 3x - 1 \).
Writing Equations of Perpendicular Lines
To write an equation of a line perpendicular to a given line, follow these steps:
- Find the slope of the given line.
- Determine the negative reciprocal of the slope.
- Use point-slope form to write the new equation.
Example: Write the equation of a line perpendicular to \( y = -\frac{1}{2}x + 3 \) that passes through (4,6).
Solution:
- The given line has a slope of \( m = -\frac{1}{2} \).
- The negative reciprocal is \( m = 2 \).
- Using point-slope form: \[ y - 6 = 2(x - 4) \]
- Simplify: \[ y - 6 = 2x - 8 \] \[ y = 2x - 2 \]
Thus, the equation of the perpendicular line is \( y = 2x - 2 \).
Real-World Applications
Parallel and perpendicular lines appear in real-world scenarios such as city streets, architectural designs, and coordinate plane maps.
Example 1: Road Construction
Engineers want to build a new road that is perpendicular to an existing road modeled by \( y = \frac{1}{3}x + 4 \). Write an equation for the new road that passes through (6,2).
Solution:
- The slope of the existing road is \( \frac{1}{3} \).
- The perpendicular slope is \( -3 \).
- Using point-slope form: \[ y - 2 = -3(x - 6) \]
- Simplify: \[ y - 2 = -3x + 18 \] \[ y = -3x + 20 \]
Thus, the equation for the perpendicular road is \( y = -3x + 20 \).
Example 2: Designing a Fence
A farmer wants to build a fence parallel to a river, which is represented by the equation \( y = -\frac{5}{4}x + 10 \). If the fence must pass through (8,3), what is its equation?
Solution:
- The slope of the river is \( -\frac{5}{4} \), so the fence must have the same slope.
- Using point-slope form: \[ y - 3 = -\frac{5}{4}(x - 8) \]
- Simplify: \[ y - 3 = -\frac{5}{4}x + 10 \] \[ y = -\frac{5}{4}x + 13 \]
Thus, the equation for the fence is \( y = -\frac{5}{4}x + 13 \).
Definitions
- Rate of change: The slope of a linear function, representing how much the dependent variable changes for each unit increase in the independent variable
- Initial value: The y-intercept of a linear function, representing the value of the dependent variable when the independent variable is zero
- Linear function: A function that can be represented by a straight line on a coordinate plane
- Qualitative analysis: Describing the overall behavior of a function without specific numerical values
- Parallel lines: Lines in the same plane that never intersect and have the same slope
- Perpendicular lines: Lines that intersect at a right angle and have slopes that are negative reciprocals of each other
Use this slide show to review these and other related terms:
Multimedia Resources
As needed, introduce the following videos:
- Linear graphs of parallel lines: https://www.media4math.com/library/44928/asset-preview
- Linear graphs of perpendicular lines: https://www.media4math.com/library/44929/asset-preview
Example 1: Distance vs. Time for Two Cars Traveling at the Same Speed
Consider two cars traveling at the same speed of 60 miles per hour. Car A leaves at time t = 0, and Car B leaves 30 minutes later.
Let t be the time in hours and d be the distance in miles.
Car A: d = 60t
Car B: d = 60(t - 0.5)
Graph these equations:
- Car A: Starts at the origin (0,0) and has a slope of 60.
- Car B: Starts at (0.5, 0) and has the same slope of 60.
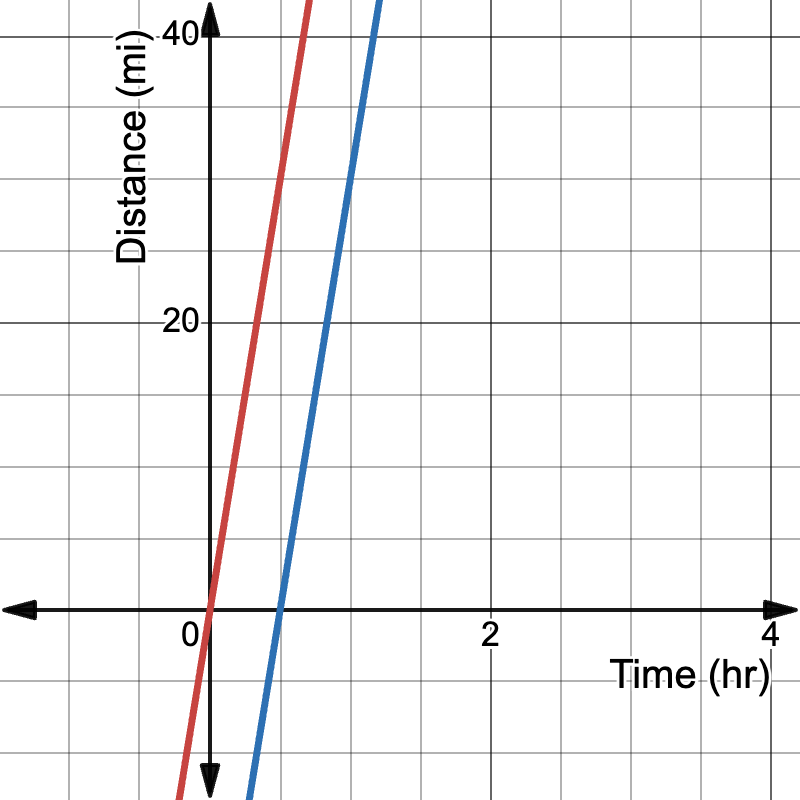
The lines are parallel because they have the same slope, representing the same speed.
Use this Desmos activity for demonstration purposes. It mirrors the graph shown above but it also has a slider for changing the speed of the cars, demonstrating that same slopes result in parallel lines:
https://www.desmos.com/calculator/bisy8qf93s
Example 2: Distance vs. Time for Two Cars, One Traveling Faster
Now consider Car A traveling at 60 miles per hour and Car B traveling at 80 miles per hour, with Car B leaving 30 minutes later.
Let t be the time in hours and d be the distance in miles.
Car A: d = 60t
Car B: d = 80(t - 0.5)
Graph these equations:
- Car A: Starts at the origin (0,0) and has a slope of 60.
- Car B: Starts at (0.5, 0) and has a slope of 80.
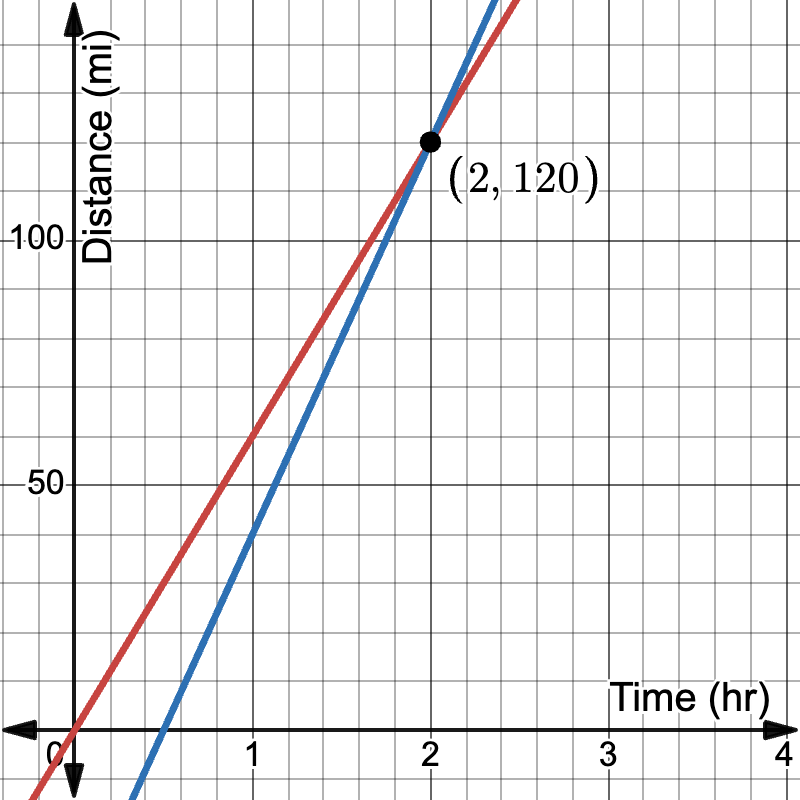
The lines are not parallel because they have different slopes. Car B's steeper slope indicates a faster speed, allowing it to catch up to Car A. Use this Desmos activity for support:
https://www.desmos.com/calculator/iizio5t9jy
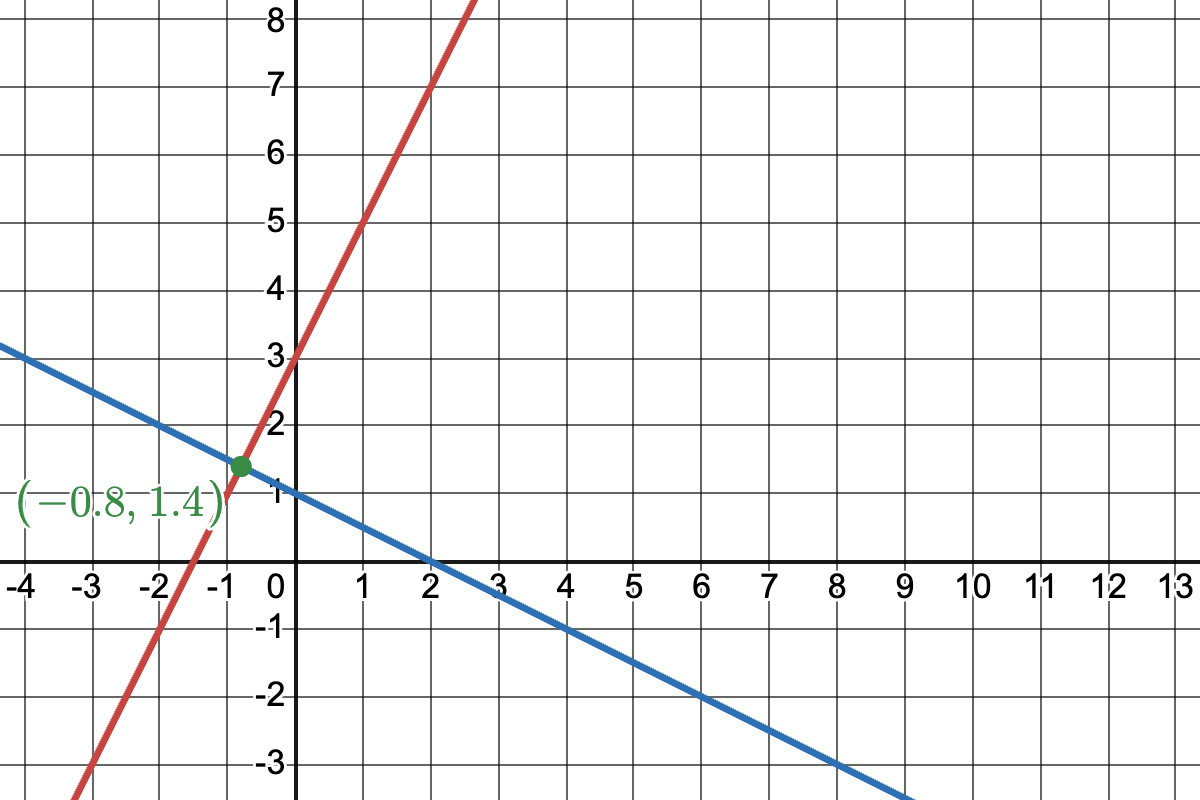
Example 3: Perpendicular Lines in Graphing
Graph the lines y = 2x + 3 and y = -0.5x + 1. Explain why these lines are perpendicular.
Solution: After graphing, we observe that the lines intersect at a right angle. They are perpendicular because their slopes are negative reciprocals of each other (2 and -0.5).
Use this Desmos activity to explore graphs of perpendicular lines. In particular have them explore the role of the y-intercept, which doesn't affect if the lines are perpindicular:
https://www.desmos.com/calculator/g2ewan7fjr
Example 4: Business Application - Smartphone Production

Samsung's largest smartphone factory in Noida, India, can produce approximately 120 million smartphones per year. Let's assume they operate 360 days a year. The company needs to produce 10 million smartphones over the next month (30 days). However, there were machinery malfunctions that cost the company 4 days of work. Find the equations for the original production line and the new production line that accounts for the delay.
Solution:
| Original daily production: For simplicity, use M to represent millions. So the smartphone rate per day is 0.33M smartphones/day. | 120 million / 360 days = 333,333 smartphones/day. |
| Original production line (direct variation): where y is the number of smartphones and x is the number of days: | y = kx |
| Plug in specific values to solve for k: | 10,000,000 = k(30) k = 0.33M |
| This is the direct variation. | y = 0.33M•x |
| We need to find a line that passes through two points: (0, -1.33M) to account for the 4-day delay (30, 10M) to meet the original target. Use the point-slope form: | y - y₁ = m(x - x₁) y - (-1.3M) = m(x - 0) |
| Calculate slope m: | m = (10M - (-1.33M)) / (30 - 0) = 11.3M / 30 = 0.378M |
| This is the new equation: | y = 0.378M•x - 1.3M |
Interpret results: The original production rate was 333,333 smartphones/day. The new production rate is 377,778 smartphones per day, an increase of about 13.3%. The y-intercept of -1.3M represents the production deficit due to the 4-day delay.
Graph both lines to visualize how the new production line intersects the original line but has a steeper slope to make up for lost time.
This Desmos activity provides a solution to this problem but uses fractional coefficients to give a more precise result:
https://www.desmos.com/calculator/n68f2pa4tc
Review
Use this slide show to review of examples of linear equations with slopes that are either parallel or perpendicular to each other:
Group activity: Students analyze and compare different linear functions representing real-world scenarios, including identifying parallel and perpendicular relationships.
Example 1: Agriculture
A farmer records the following data on wheat yield based on the amount of nitrogen fertilizer applied:
| Nitrogen (lbs/acre) | Yield (bushels/acre) |
|---|---|
| 0 | 30 |
| 50 | 45 |
| 100 | 60 |
| 150 | 75 |
Find the linear function that models this relationship and interpret the slope and y-intercept.
Solution:
| Let x be the amount of nitrogen and y be the yield. | f(x) = mx + b |
| Use two points to find the slope: | (0, 30) and (150, 75) |
| Calculate the slope: | (75 - 30) / (150 - 0) = 45 / 150 = 0.3 |
| From the data we know y-intercept | 30 |
| Write the equation: | y = 0.3x + 30 |
Interpretation:
- Slope: For every 1 lb/acre increase in nitrogen, the yield increases by 0.3 bushels/acre.
- Y-intercept: Without any nitrogen applied, the expected yield is 30 bushels/acre.
This Desmos activity can provide additional support:
https://www.desmos.com/calculator/b1howyffjg
This activity also includes an extension: A scenario for a farm with slightly less productive soil. This one results in a parallel line.
Example 2: Music
A piano tuner observes the following relationship between the length of a piano string and its frequency:
Length (cm) | Frequency (Hz) |
|---|---|
100 | 110 |
80 | 137.5 |
60 | 183.3 |
40 | 275 |
Find the linear function that models this relationship and interpret the slope and y-intercept.
Solution:
| Let x be the length of the string and y be the frequency. | y = f(x) |
| Use two points: | (100, 110) and (40, 275) |
| Calculate slope: | (275 - 110) / (40 - 100) = 165 / (-60) = -2.75 |
| Calculate y-intercept: | b = 110 + 2.75(100) = 385 |
| Linear function: | y = -2.75x + 385 |
Interpretation:
- Slope: For every 1 cm increase in string length, the frequency decreases by 2.75 Hz.
- Y-intercept: A theoretical string of 0 cm would have a frequency of 385 Hz (note: this is not physically meaningful in this context).
Here is a companion Desmos activity, which shows that the graph isn't exactly linear, but a line of best fit is very close to the calculated on above.
https://www.desmos.com/calculator/cxyznlkkqu
Quiz
Answer the following question.
- Compare the rates of change of y = 2x + 3 and y = 0.5x - 1.
- A car rental company charges a flat fee of \$30 plus \$0.25 per mile driven. Write a function to represent the total cost.
- Which has a greater initial value: y = 3x + 5 or y = 2x + 7?
- Describe the relationship between x and y in the graph of y = -2x + 4.
- If f(x) = 3x + 2 and g(x) = 3x - 1, how do these functions compare?
- A line passes through (2, 5) and (4, 9). Find its equation and interpret the slope in context.
- Write an equation for a line parallel to y = 2x - 3 that passes through the point (0, 5).
- Find the slope of a line perpendicular to y = 3x + 1.
- Are the lines y = 2x + 1 and y = -0.5x + 3 perpendicular? Explain why or why not.
- If two lines are parallel and one passes through (1, 4) and (3, 8), what is the slope of both lines?
Answer Key
- y = 2x + 3 has a greater rate of change (2 vs 0.5)
- y = 0.25x + 30, where y is total cost and x is miles driven
- y = 2x + 7 has a greater initial value
- As x increases, y decreases at a constant rate of 2 units per 1 unit of x
- They have the same slope but different y-intercepts; they are parallel.
- y = 2x + 1. The slope represents the rate of change of y with respect to x.
- y = 2x + 5
- -1/3
- Yes, because the slopes are negative reciprocals of each other.
- 2
![]() Purchase the lesson plan bundle. Click here.
Purchase the lesson plan bundle. Click here.