
Illustrative Math Alignment: Grade 7 Unit 2
Introducing Proportional Relationships
Lesson 15: Using Water Efficiently
Use the following Media4Math resources with this Illustrative Math lesson.
| Thumbnail Image | Title | Body | Curriculum Nodes |
|---|---|---|---|

|
Instructional Resource: Applications of Linear Functions: Temperature Conversion | In this Slide Show, apply concepts of linear functions to the context of converting Celsius and Fahrenheit temperatures. Note: The download is a PPT file. Related ResourcesTo see the complete collection of Tutorials on this topic, click on this link: https://bit.ly/3g0P3cN |
Applications of Linear Functions |
|
|
INSTRUCTIONAL RESOURCE: Desmos Tutorial: Matching Coordinates to Absolute Value Functions | INSTRUCTIONAL RESOURCE: Desmos Tutorial: Matching Coordinates to Absolute Value Functions
In this Slide Show, use the Desmos graphing calculator to explore absolute value functions. To see the complete collection of Desmos Resources click on this link. Note: The download is a PPT file. This is part of a collection of Desmos tutorials on a variety of math topics. To see the complete collection of these resources, click on this link.Library of Instructional ResourcesTo see the complete library of Instructional Resources , click on this link. |
Special Functions |
|
|
INSTRUCTIONAL RESOURCE: Desmos Tutorial: Matching Coordinates to Linear Functions | INSTRUCTIONAL RESOURCE: Desmos Tutorial: Matching Coordinates to Linear Functions
In this Slide Show, use the Desmos graphing calculator to explore linear functions. To see the complete collection of Desmos Resources click on this link. Note: The download is a PPT file. This is part of a collection of Desmos tutorials on a variety of math topics. To see the complete collection of these resources, click on this link.Library of Instructional ResourcesTo see the complete library of Instructional Resources , click on this link. |
Applications of Linear Functions |
|
|
INSTRUCTIONAL RESOURCE: Tutorial: Graphing Linear Functions | INSTRUCTIONAL RESOURCE: Tutorial: Graphing Linear Functions
In this Slide Show, learn about graphs of linear functions. This is part of a collection of tutorials on a variety of math topics. To see the complete collection of these resources, click on this link. Note: The download is a PPT file.Library of Instructional ResourcesTo see the complete library of Instructional Resources , click on this link. |
Applications of Linear Functions |
|
|
INSTRUCTIONAL RESOURCE: Tutorial: Linear Function Models | INSTRUCTIONAL RESOURCE: Tutorial: Linear Function Models
In this Slide Show, learn about linear function models. This is part of a collection of tutorials on a variety of math topics. To see the complete collection of these resources, click on this link. Note: The download is a PPT file.Library of Instructional ResourcesTo see the complete library of Instructional Resources , click on this link. |
Applications of Linear Functions |
|
|
INSTRUCTIONAL RESOURCE: Nspire App Tutorial: Graphs of Absolute Value Functions | In this Slide Show, absolute value functions are graphed, including graphs centered at the origin, graphs displaced along the x-axis, and graphs displaced along the y-axis. This presentation requires the use of the TI-Nspire iPad App. Note: the download is a PPT. |
Special Functions |
|
|
INSTRUCTIONAL RESOURCE: Nspire App Tutorial: Graphs of Inequalities | In this Slide Show, the Graph Window is used to graph linear inequalities. This presentation requires the use of the TI-Nspire iPad App. Note: the download is a PPT. |
Inequalities and Applications of Linear Functions |
|
|
INSTRUCTIONAL RESOURCE: Nspire App Tutorial: Graphs of Inequalities | In this Slide Show, the Graph Window is used to graph linear inequalities. This presentation requires the use of the TI-Nspire iPad App. Note: the download is a PPT. |
Inequalities and Applications of Linear Functions |
|
|
INSTRUCTIONAL RESOURCE: Nspire App Tutorial: Graphs of Inequalities with Sliders | In this Slide Show, the Graph Window is used to graph inequalities using sliders. This presentation requires the use of the TI-Nspire iPad App. Note: the download is a PPT. |
Inequalities and Applications of Linear Functions |
|
|
INSTRUCTIONAL RESOURCE: Nspire App Tutorial: Graphs of Linear Functions | In this Slide Show, linear functions are graphed. This presentation requires the use of the TI-Nspire iPad App. Note: the download is a PPT. |
Applications of Linear Functions |
|
Instructional Resource: TI-Nspire Activity: Exploring the Ratio of Circumference to Radius as a Linear Function | In this TI-Nspire Activity, use the Geometry and Graphing Tools to explore the ratio of Circumference to Radius as a linear function. Note: The Preview is a Google Slide Show and the download is a PPT. Subscribers to Media4Math can download resources. To see the complete collection of TI graphing calculator resources, click on this Link. |
Applications of Linear Functions, Applications of Circles and Geometric Constructions with Circles |
|
|
Instructional Resource: TI-Nspire Activity: Exploring the Ratio of Circumference to Radius as a Linear Function | In this TI-Nspire Activity, use the Geometry and Graphing Tools to explore the ratio of Circumference to Radius as a linear function. Note: The Preview is a Google Slide Show and the download is a PPT. Subscribers to Media4Math can download resources. To see the complete collection of TI graphing calculator resources, click on this Link. |
Applications of Linear Functions, Applications of Circles and Geometric Constructions with Circles |

|
Lesson Plan--Linear Functions and Equations (HS)--Lesson 1--Introduction to Linear Functions | Lesson Plan: Introduction to Linear Functions The Introduction to Linear Functions lesson by Media4Math is designed for high school students to grasp the fundamentals of linear functions, their properties, and real-world applications. Aligned with Common Core Standards F.IF.4 and F.LE.1, this lesson emphasizes understanding linear functions through equations and graphical representations. |
Slope-Intercept Form |

|
Lesson Plan--Linear Functions and Equations (HS)--Lesson 2--Graphing Linear Functions | Lesson Plan: Graphing Linear FunctionsLesson SummaryIn this lesson, students will explore different methods for graphing linear functions, strengthening their understanding of how algebraic equations relate to their graphical representations. The lesson covers: Graphing linear functions using slope-intercept form, standard form, and plotting points.Understanding how slope and y-intercept affect the appearance and behavior of a linear graph.Identifying the x-intercept and y-intercept and using them to analyze function behavior.By the end of this lesson, students will be proficient in graphing linear functions and interpreting their meaning in real-world applications. |
Graphs of Linear Functions |

|
Lesson Plan--Linear Functions and Equations (HS)--Lesson 3--Slope and Rate of Change | Lesson Plan: Slope and Rate of Change This comprehensive lesson plan delves into the concept of slope as a measure of the rate of change in linear functions. Students will engage with various representations—graphs, tables, and real-world scenarios—to calculate and interpret slope effectively. The lesson emphasizes contextual understanding, enabling learners to connect mathematical concepts to everyday situations. Key components of the lesson include: |
Slope-Intercept Form, Standard Form and Applications of Linear Functions |
|
|
Lesson Plan--Linear Functions and Equations (HS)--Lesson 3--Slope and Rate of Change | Lesson Plan: Slope and Rate of Change This comprehensive lesson plan delves into the concept of slope as a measure of the rate of change in linear functions. Students will engage with various representations—graphs, tables, and real-world scenarios—to calculate and interpret slope effectively. The lesson emphasizes contextual understanding, enabling learners to connect mathematical concepts to everyday situations. Key components of the lesson include: |
Slope-Intercept Form, Standard Form and Applications of Linear Functions |
|
Lesson Plan--Linear Functions and Equations (HS)--Lesson 4--Applications of Linear Functions | Lesson Plan: Applications of Linear Functions In this comprehensive lesson plan, high school students delve into the practical applications of linear functions, bridging the gap between mathematical concepts and real-world scenarios. The lesson focuses on identifying situations that can be modeled with linear equations, formulating these equations, and interpreting their components within various contexts. Key components of the lesson include: |
Slope-Intercept Form, Point-Slope Form and Standard Form |
|
|
Lesson Plan--Linear Functions and Equations (HS)--Lesson 4--Applications of Linear Functions | Lesson Plan: Applications of Linear Functions In this comprehensive lesson plan, high school students delve into the practical applications of linear functions, bridging the gap between mathematical concepts and real-world scenarios. The lesson focuses on identifying situations that can be modeled with linear equations, formulating these equations, and interpreting their components within various contexts. Key components of the lesson include: |
Slope-Intercept Form, Point-Slope Form and Standard Form |

|
Lesson Plan--Linear Functions and Equations (HS)--Lesson 5--Modeling and Analyzing Linear Functions | Lesson Plan: Modeling and Analyzing Linear Functions This lesson focuses on the application of linear functions in real-world contexts, helping students develop mathematical models to analyze and interpret relationships between variables. Students will explore various linear models, including business growth, water levels, budgeting, and physical laws such as Hooke’s Law and Boyle’s Law. Key components of this lesson include: |
Applications of Linear Functions |
|
Lesson Plan--Linear Functions and Equations (MS)--Lesson 5--Linear Functions and Applications | Lesson Plan: Linear Functions and ApplicationsThis is the fifth and final lesson in a five-part series on linear equations and inequalities designed for middle school students. In this lesson, students explore linear functions in-depth, learning how to represent them using equations, tables, and graphs. They will analyze key function properties, including slope, y-intercept, domain, and range, to develop a complete understanding of how linear functions behave. The lesson focuses on real-world applications, demonstrating how linear functions are used in various fields such as finance, physics, and business. Students will solve problems involving rates of change, cost analysis, and motion, reinforcing the practical significance of linear functions. Through guided practice and hands-on activities, they will interpret linear relationships and predict outcomes using function models. |
Applications of Linear Functions |

|
Lesson Plan--Ratios, Proportions, and Percents (Gr 6)--Lesson 2--Equivalent Ratios and Proportional Relationships | Lesson Plan: Equivalent Ratios and Proportional Relationships In this lesson, students will deepen their understanding of equivalent ratios and their role in proportional reasoning. By exploring real-world applications, students will develop the skills to recognize, create, and use equivalent ratios in practical situations. The lesson introduces multiple strategies for working with equivalent ratios, including ratio tables, scaling up and down, and solving problems using proportional reasoning. Key components of this lesson include: |
Ratios and Rates and Applications of Ratios, Proportions, and Percents |

|
Lesson Plan--Ratios, Proportions, and Percents (Gr 6)--Lesson 3--Solving Ratio and Rate Problems | Lesson Plan: Understanding Ratios and Rates This lesson introduces sixth-grade students to ratios and rates, emphasizing their applications in real-world problem-solving. Through hands-on activities, students will learn how to calculate unit rates, interpret proportional relationships, and analyze data using tables and graphs. |
Applications of Ratios, Proportions, and Percents |

|
Lesson Plan--Ratios, Proportions, and Percents (Gr 6)--Lesson 5--Applying Ratios and Proportional Reasoning | Lesson Plan: Applying Ratios and Proportional Reasoning This lesson plan is designed to provide sixth-grade students with a comprehensive understanding of ratios, proportions, and percents. Through engaging activities, hands-on explorations, and real-world applications, learners develop essential skills in comparing quantities, scaling figures up or down, and converting between fractions, decimals, and percents. This lesson emphasizes critical thinking and problem-solving strategies that help students apply mathematical reasoning to everyday situations, such as adjusting recipes, budgeting, and analyzing data. Key topics covered in this lesson include: |
Applications of Ratios, Proportions, and Percents |

|
Lesson Plan--Ratios, Proportions, and Percents (Gr 7)--Lesson 2--Unit Rates and Complex Fractions | Lesson Plan: Unit Rates and Complex Fractions This lesson introduces seventh-grade students to unit rates and complex fractions, helping them develop a deeper understanding of proportional relationships and fraction operations. Students will learn to compute unit rates with fractional quantities, simplify complex fractions, and apply these skills to real-world situations such as speed calculations, recipe adjustments, and measurement conversions. |
Ratios and Rates and Applications of Ratios, Proportions, and Percents |

|
Lesson Plan--Ratios, Proportions, and Percents (Gr 7)--Lesson 5--Solving Multi-Step Ratio and Percent Problems | Lesson Plan: Solving Multi-Step Ratio Problems In this lesson, students will develop their problem-solving skills by tackling multi-step ratio and proportion problems. They will learn how to analyze complex ratio scenarios, apply proportional reasoning, and use unit conversions to solve real-world problems. This lesson builds on students' understanding of ratios and proportions, reinforcing their ability to work through multi-step calculations with confidence. Key concepts covered in this lesson include: |
Applications of Ratios, Proportions, and Percents |

|
Lesson Plan--Ratios, Proportions, and Percents (Gr 8)--Lesson 3--Graphing and Interpreting Proportional Relationships | Lesson Plan: Graphing and Interpreting Proportional Relationships In this lesson, students will explore how to represent and analyze proportional relationships using graphs, tables, and equations. They will learn that proportional relationships follow the equation y=kx, where k is the constant of proportionality, and that these relationships always form a straight line passing through the origin on a coordinate plane. Key concepts covered in this lesson include: |
Applications of Ratios, Proportions, and Percents and Proportions |
|
|
Lesson Plan--Ratios, Proportions, and Percents (Gr 8)--Lesson 3--Graphing and Interpreting Proportional Relationships | Lesson Plan: Graphing and Interpreting Proportional Relationships In this lesson, students will explore how to represent and analyze proportional relationships using graphs, tables, and equations. They will learn that proportional relationships follow the equation y=kx, where k is the constant of proportionality, and that these relationships always form a straight line passing through the origin on a coordinate plane. Key concepts covered in this lesson include: |
Applications of Ratios, Proportions, and Percents and Proportions |

|
Lesson Plan--Ratios, Proportions, and Percents (Gr 8)--Lesson 4--Understanding Direct Variation and Its Connection to Proportional Relationships | Lesson Plan: Direct Variations In this lesson, students will explore direct variation, a special type of proportional relationship where one variable is a constant multiple of another. They will learn how to identify direct variation in tables, graphs, and equations, determine the constant of variation (k), and understand how direct variation relates to linear functions. Key concepts covered in this lesson include: |
Applications of Linear Functions and Applications of Ratios, Proportions, and Percents |

|
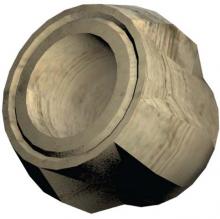
Math Clip Art--3D Objects--Gear 1 | Math Clip Art--3D Objects--Gear 1
This collection of clip art images includes images of 3D figures and composite figures. |
Applications of Ratios, Proportions, and Percents and Proportions |

|
Math Clip Art--3D Objects--Gear 2 | Math Clip Art--3D Objects--Gear 2
This collection of clip art images includes images of 3D figures and composite figures. |
Applications of Ratios, Proportions, and Percents and Proportions |
|
Math Clip Art--3D Objects--Gear 3 | Math Clip Art--3D Objects--Gear 3
This collection of clip art images includes images of 3D figures and composite figures. |
Applications of Ratios, Proportions, and Percents and Proportions |
|
Math Clip Art--Applications of Linear Functions--Business Model 1 | Math Clip Art--Applications of Linear Functions--Business Model 1TopicLinear Functions DescriptionIn this series of math clip art demonstrating applications of linear functions, the business model series offers insight into real-world uses of linear equations. This specific image serves as an introduction, presenting the title "Applications of Linear Functions: Building a Business Model." |
Applications of Linear Functions |
|
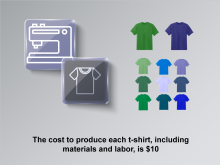
Math Clip Art--Applications of Linear Functions--Business Model 2 | Math Clip Art--Applications of Linear Functions--Business Model 2TopicLinear Functions DescriptionThis math clip art is part of a series illustrating applications of linear functions in business modeling. The image focuses on the production cost of t-shirts, highlighting that each t-shirt costs $10 to produce, including materials and labor. |
Applications of Linear Functions |

|
Math Clip Art--Applications of Linear Functions--Business Model 3 | Math Clip Art--Applications of Linear Functions--Business Model 3TopicLinear Functions DescriptionThis math clip art continues the series on applications of linear functions in business modeling. The image depicts a sewing machine with t-shirts, introducing the concept of fixed monthly costs in a business, set at $2000 for expenses like rent and utilities. |
Applications of Linear Functions |
|
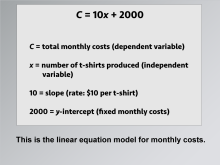
Math Clip Art--Applications of Linear Functions--Business Model 4 | Math Clip Art--Applications of Linear Functions--Business Model 4TopicLinear Functions DescriptionThis math clip art is a crucial part of the series on applications of linear functions in business modeling. It presents the equation C = 10x + 2000, which encapsulates the business model we've been building. Here, C represents the total monthly costs, x is the number of t-shirts produced, 10 is the cost per shirt, and 2000 represents the fixed monthly costs. |
Applications of Linear Functions |
|
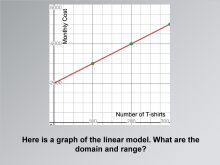
Math Clip Art--Applications of Linear Functions--Business Model 5 | Math Clip Art--Applications of Linear Functions--Business Model 5TopicLinear Functions DescriptionThis math clip art continues the series on applications of linear functions in business modeling. It presents a graph of the linear function for cost that we've been developing throughout this series. The image prompts students to consider the domain and range of this function within the context of the t-shirt business. |
Applications of Linear Functions |
|
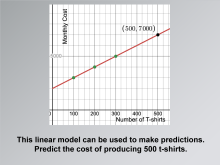
Math Clip Art--Applications of Linear Functions--Business Model 6 | Math Clip Art--Applications of Linear Functions--Business Model 6TopicLinear Functions DescriptionThis math clip art is part of a series demonstrating applications of linear functions in business modeling. The image shows a graph of the linear model we've developed, emphasizing its predictive power. It challenges students to use the model to predict the cost of producing 500 t-shirts. |
Applications of Linear Functions |
|
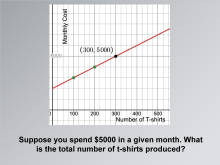
Math Clip Art--Applications of Linear Functions--Business Model 7 | Math Clip Art--Applications of Linear Functions--Business Model 7TopicLinear Functions DescriptionThis math clip art continues the series on applications of linear functions in business modeling. The image presents a graph and poses a question about determining the number of t-shirts produced given a total monthly expenditure of $5000. This scenario demonstrates how linear models can be used to solve for unknown variables. |
Applications of Linear Functions |
|
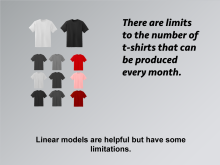
Math Clip Art--Applications of Linear Functions--Business Model 8 | Math Clip Art--Applications of Linear Functions--Business Model 8TopicLinear Functions DescriptionThis math clip art is part of a series illustrating applications of linear functions in business modeling. The image depicts t-shirts with a caption that introduces the concept of limitations in linear models. This encourages critical thinking about the applicability and constraints of mathematical models in real-world scenarios. |
Applications of Linear Functions |
|
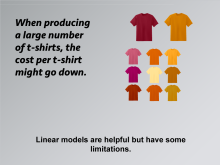
Math Clip Art--Applications of Linear Functions--Business Model 9 | Math Clip Art--Applications of Linear Functions--Business Model 9TopicLinear Functions DescriptionThis math clip art concludes the series on applications of linear functions in business modeling. The image reiterates the limitations of linear models and introduces a specific example: the possibility of reduced per-unit costs when producing large quantities of t-shirts. This concept challenges the assumption of constant per-unit costs in our linear model. |
Applications of Linear Functions |
|
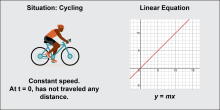
Math Clip Art: Linear Function Models 1 | Math Clip Art--Linear Function Concepts--Linear Function Models 1TopicLinear Functions DescriptionThis math clip art image is part of a series illustrating key linear function concepts. It depicts a bicycle alongside a linear graph, demonstrating the concept of constant speed. The graph shows a linear function that crosses the origin and has a positive slope, representing a scenario where at the starting point (t = 0), no distance has been traveled. |
Applications of Linear Functions |
|
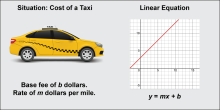
Math Clip Art: Linear Function Models 2 | Math Clip Art--Linear Function Concepts--Linear Function Models 2TopicLinear Functions DescriptionThis math clip art image is part of a series illustrating key linear function concepts. It features a taxi alongside a graph labeled "Situation: Cost of a Taxi". The graph represents a linear function with a positive y-intercept, demonstrating a scenario with a base fee and a rate per mile traveled. |
Applications of Linear Functions |
|
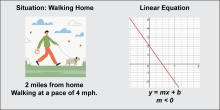
Math Clip Art: Linear Function Models 3 | Math Clip Art--Linear Function Concepts--Linear Function Models 3TopicLinear Functions DescriptionThis math clip art image is part of a series illustrating key linear function concepts. It depicts a person walking a dog alongside a graph labeled "Situation: Walking Home". The graph shows a linear function with a negative slope, representing a scenario where the distance from home decreases as time increases. |
Applications of Linear Functions |
|
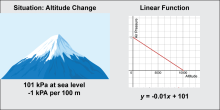
Math Clip Art: Linear Function Models 4 | Math Clip Art--Linear Function Concepts--Linear Function Models 4TopicLinear Functions DescriptionThis image is part of a series illustrating key concepts in linear functions, which are fundamental to understanding how lines behave in mathematics. The specific content of this image features a mountain and a graph titled "Situation: Altitude Change". It demonstrates a linear function with a negative slope, represented by the equation y = -0.01x + 101, showing how air pressure changes with altitude. |
Applications of Linear Functions |
|
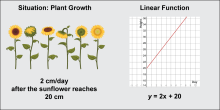
Math Clip Art: Linear Function Models 5 | Math Clip Art--Linear Function Concepts--Linear Function Models 5TopicLinear Functions DescriptionThis image is part of a series illustrating key concepts in linear functions, which are essential for understanding how lines behave in mathematics. The specific content of this image features sunflowers and a graph titled "Situation: Plant Growth". It demonstrates a linear function with a positive slope, represented by the equation y = 2x + 20, showing how the height of a sunflower changes over time. |
Applications of Linear Functions |

|
Math in the News: Issue 121--NFL Concussion Statistics | Math in the News: Issue 121 | NFL Concussion Statistics
February 2023. In this issue of Math in the News we look at NFL statistics for the number of concussions. The NFL now tracks concussion, and this is an opportunity to analyze this data and draw conclusions. —PRESS PREVIEW TO SEE THE SLIDE SHOW— This is part of the Math in the News collection. To see the complete collection, click on this link.Note: The download is a PPT file. Related ResourcesTo see resources related to this topic click on the Related Resources tab above. |
Applications of Ratios, Proportions, and Percents |