
Illustrative Math Alignment: Grade 8 Unit 9
Putting It All Together
Lesson 4: What Influences Temperature?
Use the following Media4Math resources with this Illustrative Math lesson.
| Thumbnail Image | Title | Body | Curriculum Topic |
|---|---|---|---|
|
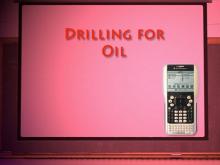
Video Transcript: Algebra Applications: Linear Functions, Segment 3: Oil Exploration | Video Transcript: Algebra Applications: Linear Functions, Segment 3: Oil Exploration
Linear Expressions, Equations, and FunctionsLinear Expressio |
Applications of Linear Functions and Graphs of Linear Functions |
|
|
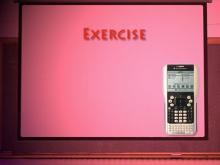
Video Transcript: Algebra Applications: Linear Functions, Segment 4: Exercise | Video Transcript: Algebra Applications: Linear Functions, Segment 4: Exercise
Linear Expressions, Equations, and FunctionsLinear Expressions |
Applications of Linear Functions and Graphs of Linear Functions |
|
|
Video Transcript: Algebra Nspirations: Data Analysis and Probability | Video Transcript: Algebra Nspirations: Data Analysis and Probability
This is the transcript for the video of same title. Video contents: What are the two meanings of statistics? What does it really mean that an event has a 50% probability of occurring? Why are data analysis and probability always taught together? Written and hosted by internationally acclaimed math educator Dr. Monica Neagoy, this video answers these questions and addresses fundamental concepts such as the law of large numbers and the notion of regression analysis. Both engaging investigations are based on true stories and real data, utilize different TI-Nspire iPad Applications, and model the seamless connection among various problem representations. Concepts explored: statistics, data analysis, regression analysis |
Data Analysis |
|
|
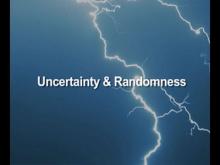
Video Transcript: Algebra Nspirations: Data Analysis and Probability, 1 | Video Transcript: Algebra Nspirations: Data Analysis and Probability, Part 1
This is the transcript for the video of same title. Video contents: In this Investigation we explore uncertainty and randomness. This is part of a collection of video transcript from the Algebra Nspirations video series. To see the complete collection of transcripts, click on this link. Note: The download is a PDF file. Video Transcript LibraryTo see the complete collection of video transcriptsy, click on this link. |
Data Analysis |
|
|
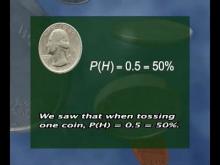
Video Transcript: Algebra Nspirations: Data Analysis and Probability, 2 | Video Transcript: Algebra Nspirations: Data Analysis and Probability, Part 2
This is the transcript for the video of same title. Video contents: In this Math Lab a hands-on probability activity involving coins is explored. This is part of a collection of video transcript from the Algebra Nspirations video series. To see the complete collection of transcripts, click on this link. Note: The download is a PDF file. Video Transcript LibraryTo see the complete collection of video transcriptsy, click on this link. |
Data Analysis |
|
|
Video Transcript: Algebra Nspirations: Functions and Relations, 2 | Video Transcript: Algebra Nspirations: Functions and Relations, Part 2
This is the transcript for the video of same title. Video contents: In this Investigation we look at functions. This is part of a collection of video transcript from the Algebra Nspirations video series. To see the complete collection of transcripts, click on this link. Note: The download is a PDF file. Video Transcript LibraryTo see the complete collection of video transcriptsy, click on this link. |
Applications of Functions and Relations and Relations and Functions |
|
|
Video Transcript: Algebra Nspirations: Linear Functions | Video Transcript: Algebra Nspirations: Linear Functions
This is the transcript for the video of same title. Video contents: In this program, internationally acclaimed mathematics educator Dr. Monica Neagoy, explores the nature of linear functions through the use TI graphing calculators. Examples ranging from air travel, construction, engineering, and space travel provide real-world examples for discovering algebraic concepts. All examples are solved algebraically and then reinforced through the use of the TI-Nspire. Algebra teachers looking to integrate hand-held technology and visual media into their instruction will benefit greatly from this series. Concepts explored: Standard form, slope-intercept form, point-slope form, solving linear equations |
Applications of Linear Functions and Graphs of Linear Functions |
|
|
Video Transcript: Algebra Nspirations: Linear Functions, 1 | Video Transcript: Algebra Nspirations: Linear Functions, Part 1
This is the transcript for the video of same title. Video contents: In this Investigation we look at linear models for objects moving at a constant speed. This is part of a collection of video transcript from the Algebra Nspirations video series. To see the complete collection of transcripts, click on this link. Note: The download is a PDF file. Video Transcript LibraryTo see the complete collection of video transcriptsy, click on this link. |
Applications of Linear Functions and Graphs of Linear Functions |
|
|
Video Transcript: Algebra Nspirations: Linear Functions, 2 | Video Transcript: Algebra Nspirations: Linear Functions, Part 2
This is the transcript for the video of same title. Video contents: In this Investigation we look at a linear regression for carbon dioxide emission data. This is part of a collection of video transcript from the Algebra Nspirations video series. To see the complete collection of transcripts, click on this link. Note: The download is a PDF file. Video Transcript LibraryTo see the complete collection of video transcriptsy, click on this link. |
Applications of Linear Functions and Graphs of Linear Functions |
|
|
Video Transcript: TI-Nspire Mini-Tutorial: A Probability Simulation of Rolling Two Dice Multiple Times (with Histogram) | Video Transcript: TI-Nspire Mini-Tutorial: A Probability Simulation of Rolling Two Dice Multiple Times (with Histogram)
This is the transcript for the TI-Nspire Mini-Tutorial entitled, A Probability Simulation of Rolling Two Dice Multiple Times (with Histogram). This is part of a collection of video transcripts for the video tutorial series on using the TI-Nspire Graphing Calculator. To see the complete collection of transcripts, click on this link. Note: The download is a PDF file. Video Transcript LibraryTo see the complete collection of video transcriptsy, click on this link. |
Probability |
|
|
Video Transcript: TI-Nspire Mini-Tutorial: A Probability Simulation of Tossing a Coin Multiple Times (with Bar Graph) | Video Transcript: TI-Nspire Mini-Tutorial: A Probability Simulation of Tossing a Coin Multiple Times (with Bar Graph)
This is the transcript for the TI-Nspire Mini-Tutorial entitled, A Probability Simulation of Tossing a Coin Multiple Times (with Bar Graph). This is part of a collection of video transcripts for the video tutorial series on using the TI-Nspire Graphing Calculator. To see the complete collection of transcripts, click on this link. Note: The download is a PDF file. Video Transcript LibraryTo see the complete collection of video transcriptsy, click on this link. |
Probability |
|
|
Video Transcript: TI-Nspire Mini-Tutorial: A Probability Simulation of Tossing Two Coins Multiple Times (with Bar Graph) | Video Transcript: TI-Nspire Mini-Tutorial: A Probability Simulation of Tossing Two Coins Multiple Times (with Bar Graph)
This is the transcript for the TI-Nspire Mini-Tutorial entitled, A Probability Simulation of Tossing Two Coins Multiple Times (with Bar Graph). This is part of a collection of video transcripts for the video tutorial series on using the TI-Nspire Graphing Calculator. To see the complete collection of transcripts, click on this link. Note: The download is a PDF file. Video Transcript LibraryTo see the complete collection of video transcriptsy, click on this link. |
Probability |
|
|
Video Transcript: TI-Nspire Mini-Tutorial: Creating a Random Number Table | Video Transcript: TI-Nspire Mini-Tutorial: Creating a Random Number Table
This is the transcript for the TI-Nspire Mini-Tutorial entitled, Creating a Random Number Table. This is part of a collection of video transcripts for the video tutorial series on using the TI-Nspire Graphing Calculator. To see the complete collection of transcripts, click on this link. Note: The download is a PDF file. Video Transcript LibraryTo see the complete collection of video transcriptsy, click on this link. |
Probability |
|
Video Tutorial: Multiple Representations of Functions | Video Tutorial: Multiple Representations of Functions
This video looks at multiple representations of functions, including symbolic, tabular, and graphic. Examples of linear, quadratic, polynomial, and exponential functions are shown. |
Relations and Functions |
|
VIDEO: Algebra Applications: Linear Functions, Segment 2: Cycling | VIDEO: Algebra Applications: Linear Functions, Segment 2: Cycling
TopicLinear Functions DescriptionApplies linear functions to cycling, calculating hill grades and distances using slope formulas and graphing. Linear functions are fundamental in understanding mathematical relationships between two variables. The video demonstrates their application in real-life scenarios, enhancing comprehension of key concepts like slope, intercepts, and graphical representation. This foundational knowledge prepares students for more advanced mathematical topics. |
Special Functions and Applications of Linear Functions |

|
VIDEO: Algebra Applications: Data Analysis, 1 | VIDEO: Algebra Applications: Data Analysis, 1
TopicData Analysis DescriptionThis segment introduces the 2008 mortgage crisis, explaining how mortgage defaults caused widespread economic repercussions, including a recession. It outlines basic mortgage concepts such as loan amount, interest rate, and repayment periods. Key terms include mortgage, interest rate, and amortization. The segment sets the stage for exploring how specific mortgage types, like subprime loans, led to financial instability. |
Data Analysis and Data Gathering |
|
VIDEO: Algebra Applications: Data Analysis, 2 | VIDEO: Algebra Applications: Data Analysis, 2
TopicData Analysis DescriptionThe video defines a mortgage as a long-term loan used to purchase a home and explains its components: loan amount, interest rate, and payment periods. Through examples, it demonstrates how interest rates impact total loan costs. Key concepts include amortization, equity, and principal versus interest payments. Applications involve using financial calculators to analyze repayment schedules and equity growth, emphasizing the importance of interest rates. |
Data Analysis and Data Gathering |
|
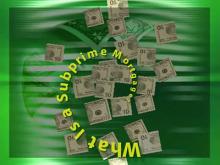
VIDEO: Algebra Applications: Data Analysis, 3 | VIDEO: Algebra Applications: Data Analysis, 3
TopicData Analysis DescriptionThis segment explains subprime mortgages, emphasizing how credit scores affect loan interest rates. It compares repayment scenarios for borrowers with different FICO scores, showing the financial challenges of subprime loans. Key terms include subprime mortgage, credit risk, and delinquency. The video uses simulations to illustrate the likelihood and impact of loan defaults, linking these trends to the mortgage crisis. |
Data Analysis and Data Gathering |
|
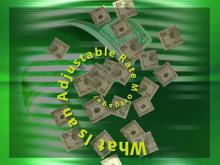
VIDEO: Algebra Applications: Data Analysis, 4 | VIDEO: Algebra Applications: Data Analysis, 4
TopicData Analysis DescriptionAdjustable-rate mortgages (ARMs) are discussed, focusing on their role in the 2008 crisis. It demonstrates how variable rates increase long-term costs and create financial risks. Concepts include loan balance, refinancing, and amortization. The video uses spreadsheets to show payment changes over time and their economic effects. Applications highlight real-world implications of rising interest rates and decreasing home values. |
Data Analysis and Data Gathering |
|
VIDEO: Algebra Applications: Linear Functions | VIDEO: Algebra Applications: Linear Functions
TopicLinear Functions |
Special Functions and Applications of Linear Functions |
|
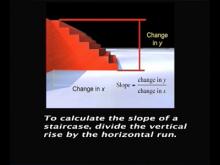
VIDEO: Algebra Applications: Linear Functions, 1 | VIDEO: Algebra Applications: Linear Functions, 1
TopicLinear Functions DescriptionIntroduces linear functions with examples like staircases, explaining slope, intercepts, and applications in real-world scenarios. Linear functions are fundamental in understanding mathematical relationships between two variables. The video demonstrates their application in real-life scenarios, enhancing comprehension of key concepts like slope, intercepts, and graphical representation. This foundational knowledge prepares students for more advanced mathematical topics. |
Special Functions and Applications of Linear Functions |
|
VIDEO: Algebra Applications: Linear Functions, 3 | VIDEO: Algebra Applications: Linear Functions, 3
TopicLinear Functions DescriptionUses linear regression to analyze US oil consumption trends, projecting future usage and potential impact of Alaskan oil production. Linear functions are fundamental in understanding mathematical relationships between two variables. The video demonstrates their application in real-life scenarios, enhancing comprehension of key concepts like slope, intercepts, and graphical representation. This foundational knowledge prepares students for more advanced mathematical topics. |
Special Functions and Applications of Linear Functions |
|
VIDEO: Algebra Applications: Linear Functions, 4 | VIDEO: Algebra Applications: Linear Functions, 4
TopicLinear Functions DescriptionModels maximum heart rate during aerobic exercise with linear equations, creating exercise charts for various age groups. Linear functions are fundamental in understanding relationships where one quantity depends linearly on another. This video provides clear examples and context that make the topic relevant and engaging. Linear equations often represent real-world scenarios, from economic trends to scientific measurements, helping students relate the math to everyday life. |
Special Functions and Applications of Linear Functions |
|
VIDEO: Algebra Nspirations: Data Analysis and Probability, 1 | VIDEO: Algebra Nspirations: Data Analysis and Probability, 1
TopicData Analysis DescriptionThis video introduces probability and statistics, differentiating between the two fields through historical context and practical applications. Concepts like the law of large numbers and randomness are explored using tools like the TI-Nspire. Key vocabulary includes probability, randomness, statistics, and law of large numbers. Applications include analyzing probabilities in real-world scenarios such as lightning strikes and coin flips. |
Data Analysis and Data Gathering |
|
VIDEO: Algebra Nspirations: Data Analysis and Probability, 2 | VIDEO: Algebra Nspirations: Data Analysis and Probability, 2
TopicData Analysis DescriptionIn this Math Lab video, students explore the probability distribution from tossing two coins. This video provides an in-depth look at Data Analysis by exploring real-world applications. It delves into in this math lab video, students explore the probability distribution from tossing two coins. The relevance of this video to the topic lies in its ability to connect theoretical concepts to practical scenarios. Students will gain insights into how these mathematical ideas are applied in data analysis. |
Data Analysis and Data Gathering |
|
VIDEO: Algebra Nspirations: Data Analysis and Probability, 3 | VIDEO: Algebra Nspirations: Data Analysis and Probability, 3
TopicData Analysis DescriptionBuilding on Part 1, this video focuses on statistical representation and interpretation. Concepts include univariate and bivariate data, regression, and data visualization techniques like bar graphs and scatter plots. Applications include analyzing dog breeds and wolf population trends using data models. Key terms include univariate, bivariate, regression, and scatter plot. |
Data Analysis and Data Gathering |
|
VIDEO: Algebra Nspirations: Data Analysis and Probability, 4 | VIDEO: Algebra Nspirations: Data Analysis and Probability, 4
TopicData Analysis DescriptionIn this Math Lab video, students explore population data. This video provides an in-depth look at Data Analysis by exploring real-world applications. It delves into in this math lab video, students explore population data. The relevance of this video to the topic lies in its ability to connect theoretical concepts to practical scenarios. Students will gain insights into how these mathematical ideas are applied in data analysis. |
Data Analysis and Data Gathering |
|
VIDEO: Algebra Nspirations: Functions and Relations, 3 | VIDEO: Algebra Nspirations: Functions and Relations, 3
TopicFunctions and Relations DescriptionBuilding on the prior section, this video elaborates on function rules and notation, graphing diverse functions such as linear, quadratic, and step functions. Key terms include domain, range, and vertical line test. Applications highlight real-world uses like analyzing study hours and grades. Technology aids in demonstrating increasing and decreasing functions visually. |
Applications of Functions and Relations, Relations and Functions and Geometric Constructions with Circles |
|
VIDEO: Algebra Nspirations: Linear Functions, 1 | VIDEO: Algebra Nspirations: Linear Functions, 1
TopicLinear Functions DescriptionThis video explores linear functions, emphasizing their applications in motion contexts like airplane altitude. Key topics include slope, y-intercept, and function representation using tools like the TI-Nspire. Vocabulary includes linear function, slope-intercept form, and dependent variable. Applications include predicting motion scenarios. |
Applications of Linear Functions |
|
VIDEO: Algebra Nspirations: Linear Functions, 2 | VIDEO: Algebra Nspirations: Linear Functions, 2
TopicLinear Functions DescriptionIn this Math Lab explore the slopes of staircases. Compare the slope of a staircase when walking it in a straight path and compare it to the slope of a staircase walked in a staggered path. In this video, students explore the mathematical concept of linear functions, gaining a deeper understanding of its applications. The video emphasizes how this concept helps in problem-solving and real-world scenarios, bridging the gap between abstract mathematics and practical application. |
Applications of Linear Functions |
|
VIDEO: Algebra Nspirations: Linear Functions, 3 | VIDEO: Algebra Nspirations: Linear Functions, 3
TopicLinear Functions DescriptionThis video applies linear functions to environmental data analysis, predicting carbon dioxide levels using regression models. Key terms include regression, scatter plot, and slope. Applications highlight global warming trends and their impact using predictive analytics. |
Applications of Linear Functions |
|
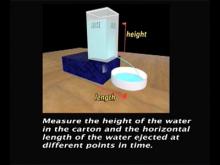
VIDEO: Algebra Nspirations: Linear Functions, 4 | VIDEO: Algebra Nspirations: Linear Functions, 4
TopicLinear Functions DescriptionIn this Math Lab explore water pressure by comparing the height of a column of water and the length of the corresponding jet of water. In this video, students explore the mathematical concept of linear functions, gaining a deeper understanding of its applications. The video emphasizes how this concept helps in problem-solving and real-world scenarios, bridging the gap between abstract mathematics and practical application. |
Applications of Linear Functions |
|
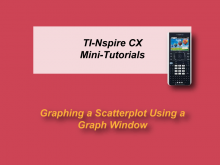
VIDEO: Ti-Nspire Mini-Tutorial, Video 6 | VIDEO: TI-Nspire CX Mini-Tutorial: Graphing a Scatterplot
In this TI-Nspire CX tutorial learn how graph data in a scatterplot using the graph window. |
Data Analysis |
|
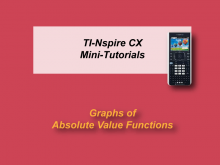
VIDEO: Ti-Nspire Mini-Tutorial, Video 7 | VIDEO: TI-Nspire CX Mini-Tutorial: Graphs of Absolute Value Functions
In this Nspire CX tutorial absolute functions are graphed, including graphs centered at the origin, graphs displaced along the x-axis, and graphs displaced along the y-axis. Note: This video does not include audio. |
Special Functions |
|
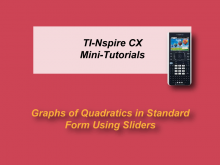
VIDEO: Ti-Nspire Mini-Tutorial, Video 10 | VIDEO: TI-Nspire CX Mini-Tutorial: Graphs of Quadratic Functions in Standard Form with Sliders
In this TI-Nspire CX tutorial learn how to graph quadratic functions in standard form using sliders for the values of a, b, and c. |
Graphs of Quadratic Functions |
|
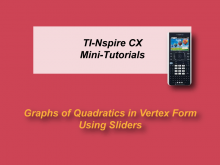
VIDEO: Ti-Nspire Mini-Tutorial, Video 11 | VIDEO: TI-Nspire CX Mini-Tutorial: Graphs of Quadratic Functions in Vertext Form with Sliders
In this TI-Nspire CX tutorial learn how to graph quadratic functions in vertex form using sliders for the values of h and k. |
Graphs of Quadratic Functions |
|
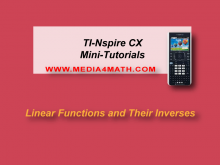
VIDEO: Ti-Nspire Mini-Tutorial, Video 12 | VIDEO: TI-Nspire CX Mini-Tutorial: Linear Functions and Their Inverses
In this Nspire CX tutorial linear functions in slope-intercept form are graphed using sliders. Then the inverse functions are graphed. Their symmetry about the graph of y = x is explored. |
Functions and Their Inverses |
|
VIDEO: Ti-Nspire Mini-Tutorial, Video 14 | VIDEO: TI-Nspire CX Mini-Tutorial: Parallel and Perpendicular Lines
In this TI-Nspire CX tutorial explore the properties of parallel and perpendicular lines. Use a slider to define the slope and then graph parallel and perpendicular lines linked to this slider. Note: This video does not contain audio. |
Parallel Lines and Perpendicular Lines |

|
VIDEO: Ti-Nspire Mini-Tutorial, Video 17 | VIDEO: TI-Nspire CX Mini-Tutorial: Quadratic Regression
In this TI-Nspire CX tutorial learn how to perform a quadratic regression based on scatterplot data. Note: This video does not contain audio. |
Data Analysis |
|
VIDEO: Ti-Nspire Mini-Tutorial, Video 35 | VIDEO: TI-Nspire Mini-Tutorial: A Probability Simulation of Rolling Two Dice Multiple Times (with Histogram)
In this TI Nspire tutorialthe Spreadsheet and Statistics windows are used to create a probability simulation of tossing two dice. This video supports the TI-Nspire Clickpad and Touchpad. |
Probability |
|
VIDEO: Ti-Nspire Mini-Tutorial, Video 36 | VIDEO: TI-Nspire Mini-Tutorial: A Probability Simulation of Tossing a Coin Multiple Times (with Bar Graph)
In this TI Nspire tutorial, the Spreadsheet and Statistics windows are used to create a probability simulation of a coin toss. This video supports the TI-Nspire Clickpad and Touchpad. |
Probability |
|
VIDEO: Ti-Nspire Mini-Tutorial, Video 37 | VIDEO: TI-Nspire Mini-Tutorial: A Probability Simulation of Tossing Two Coins Multiple Times (with Bar Graph)
In this TI Nspire tutorial, the Spreadsheet and Statistics windows are used to create a probability simulation of tossing two coins. This video supports the TI-Nspire Clickpad and Touchpad. |
Probability |
|
VIDEO: Ti-Nspire Mini-Tutorial, Video 55 | VIDEO: TI-Nspire Mini-Tutorial: Creating a Random Number Table
In this TI Nspire tutorial, the Spreadsheet window is used to create a random number table. This video supports the TI-Nspire Clickpad and Touchpad. |
Probability |
|
Worksheet: Crossword Puzzle--Parallel and Perpendicular Lines | Worksheet: Crossword Puzzle--Parallel and Perpendicular Lines
This is part of a collection of math worksheets that are crossword puzzles of math vocabulary. To see the complete worksheet collection on this topic, click on this link. Note: The download is a PDF file.Related ResourcesTo see additional resources on this topic, click on the Related Resources tab.Worksheet LibraryTo see the complete collection of Worksheets, click on this link. |
Parallel Lines and Perpendicular Lines |
|
Worksheet: TI-Nspire Mini-Tutorial: Exploring the Slope-Intercept form Using Sliders | Worksheet: TI-Nspire Mini-Tutorial: Exploring the Slope-Intercept form Using Sliders
This is part of a collection of math worksheets on the use of the TI-Nspire graphing calculator. Each worksheet supports a companion TI-Nspire Mini-Tutorial video. It provides all the keystrokes for the activity. To see the complete worksheet collection on this topic, click on this link. Note: The download is a PDF file.Related ResourcesTo see additional resources on this topic, click on the Related Resources tab.Worksheet LibraryTo see the complete collection of Worksheets, click on this link. |
Slope-Intercept Form |
|
|
Worksheet: TI-Nspire Mini-Tutorial: Graphing a Linear Function | Worksheet: TI-Nspire Mini-Tutorial: Graphing a Linear Function
This is part of a collection of math worksheets on the use of the TI-Nspire graphing calculator. Each worksheet supports a companion TI-Nspire Mini-Tutorial video. It provides all the keystrokes for the activity. To see the complete worksheet collection on this topic, click on this link. Note: The download is a PDF file.Related ResourcesTo see additional resources on this topic, click on the Related Resources tab.Worksheet LibraryTo see the complete collection of Worksheets, click on this link. |
Graphs of Linear Functions |
|
|
Worksheet: TI-Nspire Mini-Tutorial: Graphing a Linear Inequality | Worksheet: TI-Nspire Mini-Tutorial: Graphing a Linear Inequality
This is part of a collection of math worksheets on the use of the TI-Nspire graphing calculator. Each worksheet supports a companion TI-Nspire Mini-Tutorial video. It provides all the keystrokes for the activity. To see the complete worksheet collection on this topic, click on this link. Note: The download is a PDF file.Related ResourcesTo see additional resources on this topic, click on the Related Resources tab.Worksheet LibraryTo see the complete collection of Worksheets, click on this link. |
Inequalities |
|
|
Worksheet: TI-Nspire Mini-Tutorial: Graphing a Linear Inequality | Worksheet: TI-Nspire Mini-Tutorial: Graphing a Linear Inequality
This is part of a collection of math worksheets on the use of the TI-Nspire graphing calculator. Each worksheet supports a companion TI-Nspire Mini-Tutorial video. It provides all the keystrokes for the activity. To see the complete worksheet collection on this topic, click on this link. Note: The download is a PDF file.Related ResourcesTo see additional resources on this topic, click on the Related Resources tab.Worksheet LibraryTo see the complete collection of Worksheets, click on this link. |
Inequalities |