
Illustrative Math Alignment: Grade 6 Unit 2
Introducing Ratios
Lesson 1: Introducing Ratios and Ratio Language
Use the following Media4Math resources with this Illustrative Math lesson.
| Thumbnail Image | Title | Body | Curriculum Topic |
|---|---|---|---|
|
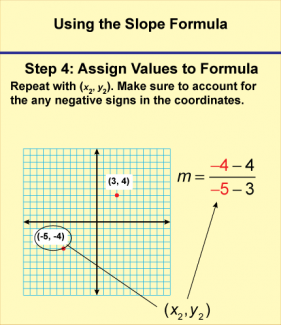
Math Clip Art--Linear Functions Concepts--Using the Slope Formula 5 |
Math Clip Art--Linear Functions Concepts--Using the Slope Formula 5TopicLinear Functions DescriptionThis image continues the series, focusing on Step 4 of using the slope formula: "Assign Values to Formula." It completes the assignment of coordinate values in the slope formula. In this case we deal with x2 and y2. Teachers can walk students through this step by saying: "Now we complete the assignment of coordinate values into the slope formula. In this case we deal with x2 and y2. Do you see how those coordinates are highlighted in the formula?" |
Slope and Ratios and Rates |
|
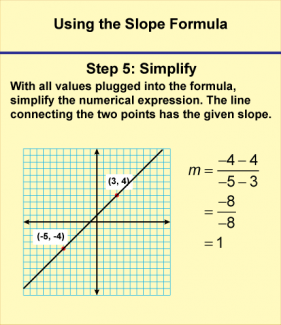
Math Clip Art--Linear Functions Concepts--Using the Slope Formula 6 |
Math Clip Art--Linear Functions Concepts--Using the Slope Formula 6TopicLinear Functions DescriptionThis final image in the series focuses on Step 5 of using the slope formula: "Simplify." It shows how to express the calculated slope in its simplest form, if necessary. Teachers can conclude the lesson with this step by saying: "Our last step is to simplify our result if possible. Sometimes, our slope might be a fraction that can be reduced. Other times, it might already be in its simplest form. Why is it important to express our slope in the simplest possible way? How does this final step help us interpret what the slope means in the context of our line?" |
Slope and Ratios and Rates |
|
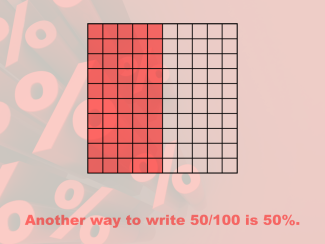
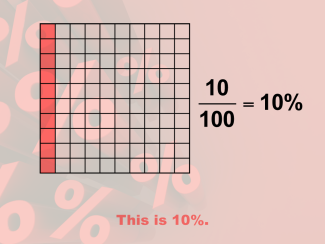
Math Clip Art--Percent Visualizations 1 |
Math Clip Art--Percent Visualizations 1 This is a collection of clip art images that show visual models for percents. |
Ratios and Rates and Percents |

|
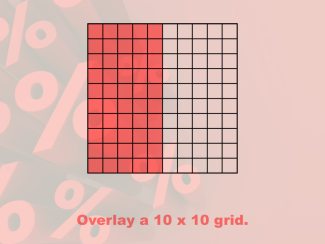
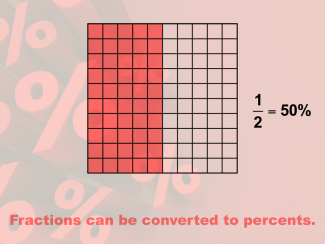
Math Clip Art--Percent Visualizations 2 |
Math Clip Art--Percent Visualizations 2 This is a collection of clip art images that show visual models for percents. |
Ratios and Rates and Percents |
|
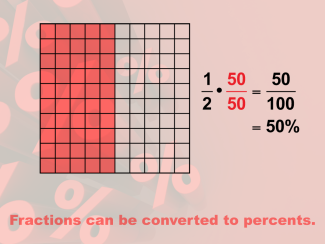
Math Clip Art--Percent Visualizations 3 |
Math Clip Art--Percent Visualizations 3 This is a collection of clip art images that show visual models for percents. |
Ratios and Rates and Percents |

|
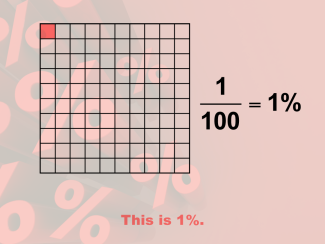
Math Clip Art--Percent Visualizations 4 |
Math Clip Art--Percent Visualizations 4 This is a collection of clip art images that show visual models for percents. |
Ratios and Rates and Percents |
|
Math Clip Art--Percent Visualizations 5 |
Math Clip Art--Percent Visualizations 5 This is a collection of clip art images that show visual models for percents. |
Ratios and Rates and Percents |
|
Math Clip Art--Percent Visualizations 6 |
Math Clip Art--Percent Visualizations 6 This is a collection of clip art images that show visual models for percents. |
Ratios and Rates and Percents |
|
Math Clip Art--Percent Visualizations 7 |
Math Clip Art--Percent Visualizations 7 This is a collection of clip art images that show visual models for percents. |
Ratios and Rates and Percents |
|
Math Clip Art--Percent Visualizations 8 |
Math Clip Art--Percent Visualizations 8 This is a collection of clip art images that show visual models for percents. |
Ratios and Rates and Percents |
|
Math Clip Art--Percent Visualizations 9 |
Math Clip Art--Percent Visualizations 9 This is a collection of clip art images that show visual models for percents. |
Ratios and Rates and Percents |
|
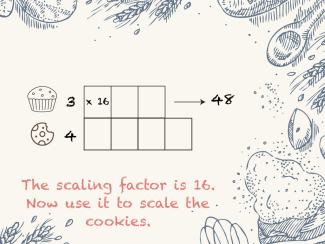
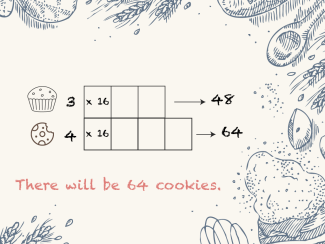
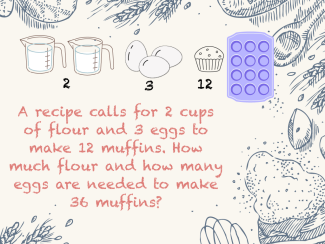
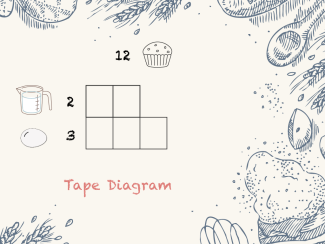
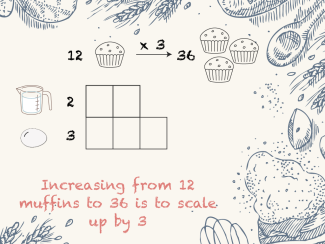
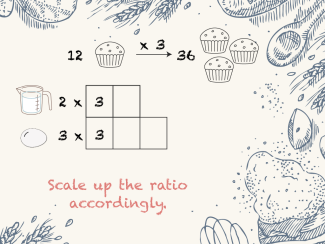
Math Clip Art--Rates and Tape Diagrams: Cooking 1 |
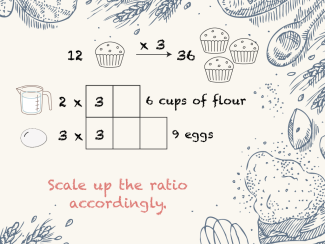
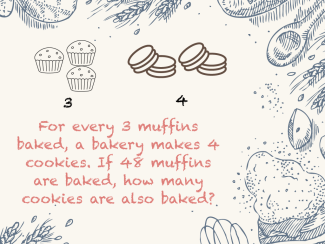
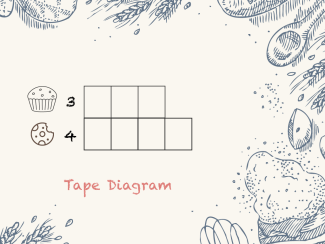
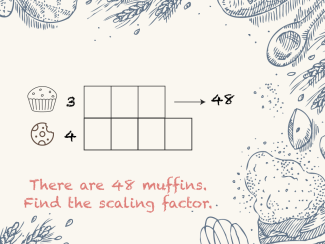
Math Clip Art--Rates and Tape Diagrams: Cooking 1 This is a collection of clip art images that show how to use tape diagrams to solve ratio and rate problems. |
Ratios and Rates |
|
Math Clip Art--Rates and Tape Diagrams: Cooking 10 |
Math Clip Art--Rates and Tape Diagrams: Cooking 10 This is a collection of clip art images that show how to use tape diagrams to solve ratio and rate problems. |
Ratios and Rates |
|
Math Clip Art--Rates and Tape Diagrams: Cooking 11 |
Math Clip Art--Rates and Tape Diagrams: Cooking 11 This is a collection of clip art images that show how to use tape diagrams to solve ratio and rate problems. |
Ratios and Rates |
|
Math Clip Art--Rates and Tape Diagrams: Cooking 2 |
Math Clip Art--Rates and Tape Diagrams: Cooking 2 This is a collection of clip art images that show how to use tape diagrams to solve ratio and rate problems. |
Ratios and Rates |
|
Math Clip Art--Rates and Tape Diagrams: Cooking 3 |
Math Clip Art--Rates and Tape Diagrams: Cooking 3 This is a collection of clip art images that show how to use tape diagrams to solve ratio and rate problems. |
Ratios and Rates |
|
Math Clip Art--Rates and Tape Diagrams: Cooking 4 |
Math Clip Art--Rates and Tape Diagrams: Cooking 4 This is a collection of clip art images that show how to use tape diagrams to solve ratio and rate problems. |
Ratios and Rates |
|
Math Clip Art--Rates and Tape Diagrams: Cooking 5 |
Math Clip Art--Rates and Tape Diagrams: Cooking 5 This is a collection of clip art images that show how to use tape diagrams to solve ratio and rate problems. |
Ratios and Rates |
|
Math Clip Art--Rates and Tape Diagrams: Cooking 6 |
Math Clip Art--Rates and Tape Diagrams: Cooking 6 This is a collection of clip art images that show how to use tape diagrams to solve ratio and rate problems. |
Ratios and Rates |
|
Math Clip Art--Rates and Tape Diagrams: Cooking 7 |
Math Clip Art--Rates and Tape Diagrams: Cooking 7 This is a collection of clip art images that show how to use tape diagrams to solve ratio and rate problems. |
Ratios and Rates |
|
Math Clip Art--Rates and Tape Diagrams: Cooking 8 |
Math Clip Art--Rates and Tape Diagrams: Cooking 8 This is a collection of clip art images that show how to use tape diagrams to solve ratio and rate problems. |
Ratios and Rates |
|
Math Clip Art--Rates and Tape Diagrams: Cooking 9 |
Math Clip Art--Rates and Tape Diagrams: Cooking 9 This is a collection of clip art images that show how to use tape diagrams to solve ratio and rate problems. |
Ratios and Rates |

|
Math Clip Art--Ratios, Proportions, Percents--Rates 01 |
Math Clip Art--Ratios, Proportions, Percents--Rates 01TopicRatios, Proportions, and Percents DescriptionThe image shows a hurdler jumping over a hurdle, with an overlay of the golden ratio (1.618). It introduces the concept of rates by visually showing motion and proportions. This image sets the stage for understanding rates as a mathematical relationship and connects to the idea of proportion and efficiency, aligning with rates' use in describing relationships. Ratios, Proportions, and Percents focuses on understanding and applying the concept of rates, which are comparisons of two quantities with different units. |
Ratios and Rates |

|
Math Clip Art--Ratios, Proportions, Percents--Rates 02 |
Math Clip Art--Ratios, Proportions, Percents--Rates 02TopicRatios, Proportions, and Percents DescriptionThe image depicts a gas station with the formula Rate = a / b, where b ≠ 0, defining rate as a ratio of two different units. It introduces the formal definition of rates, providing a foundation for subsequent examples that apply this definition in real-world contexts. Ratios, Proportions, and Percents focuses on understanding and applying the concept of rates, which are comparisons of two quantities with different units. |
Ratios and Rates |

|
Math Clip Art--Ratios, Proportions, Percents--Rates 03 |
Math Clip Art--Ratios, Proportions, Percents--Rates 03TopicRatios, Proportions, and Percents DescriptionThe image shows a car at a gas station with the formula Speed = Distance / Time, explaining speed as a specific example of rate. It connects the abstract concept of rates to a concrete example (speed), making the topic relatable and easier to understand. Ratios, Proportions, and Percents focuses on understanding and applying the concept of rates, which are comparisons of two quantities with different units. |
Ratios and Rates |

|
Math Clip Art--Ratios, Proportions, Percents--Rates 04 |
Math Clip Art--Ratios, Proportions, Percents--Rates 04TopicRatios, Proportions, and Percents DescriptionThe image highlights a gasoline pump with the formula Rate = Dollars / Gallon, illustrating the cost of gasoline as an example of rate. It applies the concept of rates to another common scenario, reinforcing the idea of rates in daily life and extending understanding from speed to cost per unit. Ratios, Proportions, and Percents focuses on understanding and applying the concept of rates, which are comparisons of two quantities with different units. |
Ratios and Rates |

|
Math Clip Art--Ratios, Proportions, Percents--Rates 05 |
Math Clip Art--Ratios, Proportions, Percents--Rates 05TopicRatios, Proportions, and Percents DescriptionThe image depicts a car with the formula Fuel Efficiency Rate = Miles / Gallon, explaining how fuel efficiency is measured as a rate. It introduces a third example of rates, connecting to environmental and economic considerations, and further solidifying understanding. Ratios, Proportions, and Percents focuses on understanding and applying the concept of rates, which are comparisons of two quantities with different units. |
Ratios and Rates |

|
Math Clip Art--Ratios, Proportions, Percents--Rates 06 |
Math Clip Art--Ratios, Proportions, Percents--Rates 06TopicRatios, Proportions, and Percents DescriptionThe image shows a fruit market with the formula Rate = Dollars / Pound, illustrating the cost of fruits and vegetables per unit weight. It expands the application of rates to another familiar scenario, demonstrating versatility in its use across contexts. Ratios, Proportions, and Percents focuses on understanding and applying the concept of rates, which are comparisons of two quantities with different units. |
Ratios and Rates |

|
Math Clip Art--Ratios, Proportions, Percents--Rates 07 |
Math Clip Art--Ratios, Proportions, Percents--Rates 07TopicRatios, Proportions, and Percents DescriptionThe image shows a carton of eggs priced at $4 a dozen, defining a unit rate where b = 1, expressed as whole numbers or decimals. It introduces the concept of unit rates, a special type of rate, laying the groundwork for calculations in subsequent images. Ratios, Proportions, and Percents focuses on understanding and applying the concept of rates, which are comparisons of two quantities with different units. |
Ratios and Rates |

|
Math Clip Art--Ratios, Proportions, Percents--Rates 08 |
Math Clip Art--Ratios, Proportions, Percents--Rates 08TopicRatios, Proportions, and Percents DescriptionThe image features lemons priced at $2.50 for 5, with the calculation Unit Rate = 2.50 / 5 = 0.50 per lemon. It provides a step-by-step calculation of unit rates, reinforcing the concept introduced earlier with practical application. Ratios, Proportions, and Percents focuses on understanding and applying the concept of rates, which are comparisons of two quantities with different units. |
Ratios and Rates |

|
Math Clip Art--Ratios, Proportions, Percents--Rates 09 |
Math Clip Art--Ratios, Proportions, Percents--Rates 09TopicRatios, Proportions, and Percents DescriptionThe image illustrates the cost of 5 pounds of ground beef at $15.75, with the calculation Unit Rate = 15.75 / 5 = 3.25 per pound. It demonstrates another example of calculating unit rates, solidifying the learner's ability to perform similar calculations. Ratios, Proportions, and Percents focuses on understanding and applying the concept of rates, which are comparisons of two quantities with different units. |
Ratios and Rates |

|
Math Clip Art--Ratios, Proportions, Percents--Rates 10 |
Math Clip Art--Ratios, Proportions, Percents--Rates 10TopicRatios, Proportions, and Percents DescriptionThe image shows a runner covering 8 miles in 1.25 hours, with the calculation Speed = 8 / 1.25 = 6.4 miles/hour. It reinforces the speed example from earlier, providing another opportunity to apply the concept of rates to motion. Ratios, Proportions, and Percents focuses on understanding and applying the concept of rates, which are comparisons of two quantities with different units. |
Ratios and Rates |

|
Math Clip Art--Ratios, Proportions, Percents--Ratios 01 |
Math Clip Art--Ratios, Proportions, Percents--Ratios 01TopicRatios, Proportions, and Percents DescriptionThis image establishes the mathematical foundation for understanding ratios with an iconic example. Ratios, Proportions, and Percents is a fundamental concept in mathematics that helps students understand proportional reasoning, scaling, and comparative analysis. These examples provide a bridge between abstract mathematical principles and real-world applications, helping students grasp the utility of ratios. |
Ratios and Rates |

|
Math Clip Art--Ratios, Proportions, Percents--Ratios 02 |
Math Clip Art--Ratios, Proportions, Percents--Ratios 02TopicRatios, Proportions, and Percents DescriptionDefinition of a ratio as a relationship between two quantities using sports balls. It introduces the concept of ratios in an accessible and relatable way. Ratios, Proportions, and Percents is a fundamental concept in mathematics that helps students understand proportional reasoning, scaling, and comparative analysis. These examples provide a bridge between abstract mathematical principles and real-world applications, helping students grasp the utility of ratios. |
Ratios and Rates |

|
Math Clip Art--Ratios, Proportions, Percents--Ratios 03 |
Math Clip Art--Ratios, Proportions, Percents--Ratios 03TopicRatios, Proportions, and Percents DescriptionVisual example of ratios using soccer balls and basketballs, expressed as 5:2, 5 to 2, and 5 / 2. Illustrates how ratios can be represented in multiple formats. Ratios, Proportions, and Percents is a fundamental concept in mathematics that helps students understand proportional reasoning, scaling, and comparative analysis. These examples provide a bridge between abstract mathematical principles and real-world applications, helping students grasp the utility of ratios. |
Ratios and Rates |

|
Math Clip Art--Ratios, Proportions, Percents--Ratios 04 |
Math Clip Art--Ratios, Proportions, Percents--Ratios 04TopicRatios, Proportions, and Percents DescriptionA table summarizing different ratios derived from the group of balls, e.g., soccer to baseball or soccer to basketball. Shows how to systematically calculate and organize ratios from a dataset. Ratios, Proportions, and Percents is a fundamental concept in mathematics that helps students understand proportional reasoning, scaling, and comparative analysis. These examples provide a bridge between abstract mathematical principles and real-world applications, helping students grasp the utility of ratios. |
Ratios and Rates |

|
Math Clip Art--Ratios, Proportions, Percents--Ratios 05 |
Math Clip Art--Ratios, Proportions, Percents--Ratios 05TopicRatios, Proportions, and Percents DescriptionSimplification of ratios in the table, e.g., 4 / 2 becomes 2 / 1. Highlights the importance of simplifying ratios for clarity and consistency. Ratios, Proportions, and Percents is a fundamental concept in mathematics that helps students understand proportional reasoning, scaling, and comparative analysis. These examples provide a bridge between abstract mathematical principles and real-world applications, helping students grasp the utility of ratios. |
Ratios and Rates |

|
Math Clip Art--Ratios, Proportions, Percents--Ratios 06 |
Math Clip Art--Ratios, Proportions, Percents--Ratios 06TopicRatios, Proportions, and Percents DescriptionApplication of ratios to geometric shapes (circles, triangles, hexagons) with a table of ratios. Extends the concept of ratios to other objects, demonstrating versatility. Ratios, Proportions, and Percents is a fundamental concept in mathematics that helps students understand proportional reasoning, scaling, and comparative analysis. These examples provide a bridge between abstract mathematical principles and real-world applications, helping students grasp the utility of ratios. |
Ratios and Rates |

|
Math Clip Art--Ratios, Proportions, Percents--Ratios 07 |
Math Clip Art--Ratios, Proportions, Percents--Ratios 07TopicRatios, Proportions, and Percents DescriptionSimplified ratios in the table for geometric shapes. Reinforces the practice of simplifying ratios for better comprehension. Ratios, Proportions, and Percents is a fundamental concept in mathematics that helps students understand proportional reasoning, scaling, and comparative analysis. These examples provide a bridge between abstract mathematical principles and real-world applications, helping students grasp the utility of ratios. |
Ratios and Rates |

|
Math Clip Art--Ratios, Proportions, Percents--Ratios 08 |
Math Clip Art--Ratios, Proportions, Percents--Ratios 08TopicRatios, Proportions, and Percents DescriptionExample of a three-term ratio (Red : Yellow : Blue = 6 : 4 : 3) using lollipops. Expands understanding of ratios to include three quantities. Ratios, Proportions, and Percents is a fundamental concept in mathematics that helps students understand proportional reasoning, scaling, and comparative analysis. These examples provide a bridge between abstract mathematical principles and real-world applications, helping students grasp the utility of ratios. |
Ratios and Rates |

|
Math Clip Art--Ratios, Proportions, Percents--Ratios 09 |
Math Clip Art--Ratios, Proportions, Percents--Ratios 09TopicRatios, Proportions, and Percents DescriptionThree-term ratios applied to a recipe: Flour : Sugar : Milk = 3 : 2 : 1. Connects ratios to real-world applications, specifically in cooking. Ratios, Proportions, and Percents is a fundamental concept in mathematics that helps students understand proportional reasoning, scaling, and comparative analysis. These examples provide a bridge between abstract mathematical principles and real-world applications, helping students grasp the utility of ratios. |
Ratios and Rates |

|
Math Clip Art--Ratios, Proportions, Percents--Ratios 10 |
Math Clip Art--Ratios, Proportions, Percents--Ratios 10TopicRatios, Proportions, and Percents DescriptionFractions in ratios: Milk to Water = 1/4 : 1/2, simplified to 1 : 2. Demonstrates handling fractional ratios and simplifying them to whole numbers. Ratios, Proportions, and Percents is a fundamental concept in mathematics that helps students understand proportional reasoning, scaling, and comparative analysis. These examples provide a bridge between abstract mathematical principles and real-world applications, helping students grasp the utility of ratios. |
Ratios and Rates |

|
Math Clip Art--Ratios, Proportions, Percents--Ratios 11 |
Math Clip Art--Ratios, Proportions, Percents--Ratios 11TopicRatios, Proportions, and Percents DescriptionDemonstrates equivalent ratios by simplifying fractions for Red:Green (4:2 to 2:1) and Strawberries:Lemons (6:3 to 2:1). Emphasizes the concept of equivalent ratios by showing how they simplify to the same value, reinforcing previous examples. Ratios, Proportions, and Percents is a fundamental concept in mathematics that helps students understand proportional reasoning, scaling, and comparative analysis. These examples provide a bridge between abstract mathematical principles and real-world applications, helping students grasp the utility of ratios. |
Ratios and Rates |
|
Math Clip Art--Simple Ratios 1 |
Math Clip Art--Simple Ratios 1 This is a collection of clip art images that show simple ratios. |
Ratios and Rates |

|
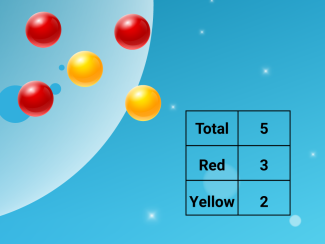
Math Clip Art--Simple Ratios 2 |
Math Clip Art--Simple Ratios 2 This is a collection of clip art images that show simple ratios. |
Ratios and Rates |
|
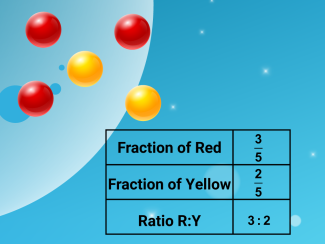
Math Clip Art--Simple Ratios 3 |
Math Clip Art--Simple Ratios 3 This is a collection of clip art images that show simple ratios. |
Ratios and Rates |
|
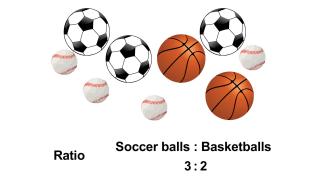
Math Clip Art--Simple Ratios 4 |
Math Clip Art--Simple Ratios 4 This is a collection of clip art images that show simple ratios. |
Ratios and Rates |
|
Math Clip Art: Slope vs. Rate |
Math Clip Art: Slope vs. Rate In these clip art images, show students the difference between ratios and rates. These images are useful when talking about slope as both a ratio and a rate. In particular, this is useful when talking about slope as a rate of change. |
Slope and Ratios and Rates |

|
Math Example--Ratios and Rates--Example 1 |
Math Example--Ratios and Rates--Example 1TopicRatios and Rates DescriptionThis math example focuses on understanding ratios using colored socks. The image displays a collection of red and blue socks, and students are asked to determine the ratio of red socks to blue socks. The solution demonstrates that there are 4 pairs of red socks and 4 pairs of blue socks, resulting in a ratio of 4 : 4, which simplifies to 1 : 1. |
Ratios and Rates |

|
Math Example--Ratios and Rates--Example 10 |
Math Example--Ratios and Rates--Example 10TopicRatios and Rates DescriptionThis example focuses on finding equivalent ratios using a collection of socks in various colors. The image shows socks arranged in rows, with black, green, white, and other colors present. Students are asked to find a ratio among three colors that is equivalent to 1 : 3 : 1. |
Ratios and Rates |