
Illustrative Math Alignment: Grade 6 Unit 8
Data Sets and Distributions
Lesson 18: Using Data to Solve Problems
Use the following Media4Math resources with this Illustrative Math lesson.
| Thumbnail Image | Title | Body | Curriculum Nodes |
|---|---|---|---|

|
Closed Captioned Video: Measures of Central Tendency: Finding the Mean of a Data Set I | Closed Captioned Video: Measures of Central Tendency: Finding the Mean of a Data Set I
In this video tutorial students learn how to calculate the mean when all of the data items are positive numbers. Includes three real-world examples. |
Data Analysis and Data Gathering |
|
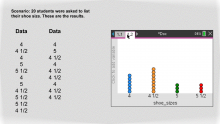
Math Clip Art--Statistics--Line Plots with Data--01 | Math Clip Art--Statistics--Line Plots with Data--01 This is part of a collection of math clip art images that show different statistical graphs and concepts, along with some probability concepts. |
Data Analysis |
|
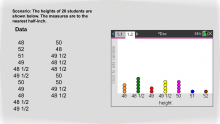
Math Clip Art--Statistics--Line Plots with Data--02 | Math Clip Art--Statistics--Line Plots with Data--02 This is part of a collection of math clip art images that show different statistical graphs and concepts, along with some probability concepts. |
Data Analysis |
|
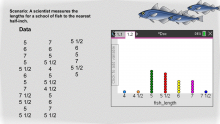
Math Clip Art--Statistics--Line Plots with Data--03 | Math Clip Art--Statistics--Line Plots with Data--03 This is part of a collection of math clip art images that show different statistical graphs and concepts, along with some probability concepts. |
Data Analysis |
|
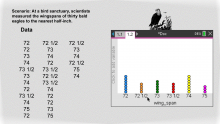
Math Clip Art--Statistics--Line Plots with Data--04 | Math Clip Art--Statistics--Line Plots with Data--04 This is part of a collection of math clip art images that show different statistical graphs and concepts, along with some probability concepts. |
Data Analysis |
|
Math Clip Art--Statistics--Line Plots with Data--05 | Math Clip Art--Statistics--Line Plots with Data--05 This is part of a collection of math clip art images that show different statistical graphs and concepts, along with some probability concepts. |
Data Analysis |
|
Math Clip Art--Statistics--Line Plots with Data--06 | Math Clip Art--Statistics--Line Plots with Data--06 This is part of a collection of math clip art images that show different statistical graphs and concepts, along with some probability concepts. |
Data Analysis |
|
Math Clip Art--Statistics--Line Plots with Data--07 | Math Clip Art--Statistics--Line Plots with Data--07 This is part of a collection of math clip art images that show different statistical graphs and concepts, along with some probability concepts. |
Data Analysis |
|
Math Clip Art--Statistics--Line Plots with Data--08 | Math Clip Art--Statistics--Line Plots with Data--08 This is part of a collection of math clip art images that show different statistical graphs and concepts, along with some probability concepts. |
Data Analysis |
|
Math Clip Art--Statistics--Line Plots with Data--09 | Math Clip Art--Statistics--Line Plots with Data--09 This is part of a collection of math clip art images that show different statistical graphs and concepts, along with some probability concepts. |
Data Analysis |
|
Math Clip Art--Statistics--Line Plots with Data--10 | Math Clip Art--Statistics--Line Plots with Data--10 This is part of a collection of math clip art images that show different statistical graphs and concepts, along with some probability concepts. |
Data Analysis |
|
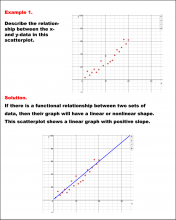
Math Example--Charts, Graphs, and Plots--Analyzing Scatterplots: Example 1 | Math Example--Charts, Graphs, and Plots-- Analyzing Scatterplots: Example 1
In this set of math examples, analyze the behavior of different scatterplots. This includes linear and quadratic models. |
Data Analysis |
|
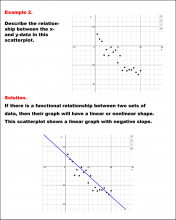
Math Example--Charts, Graphs, and Plots--Analyzing Scatterplots: Example 2 | Math Example--Charts, Graphs, and Plots-- Analyzing Scatterplots: Example 2
In this set of math examples, analyze the behavior of different scatterplots. This includes linear and quadratic models. |
Data Analysis |

|
Math Example--Charts, Graphs, and Plots--Analyzing Scatterplots: Example 3 | Math Example--Charts, Graphs, and Plots-- Analyzing Scatterplots: Example 3
In this set of math examples, analyze the behavior of different scatterplots. This includes linear and quadratic models. |
Data Analysis |
|
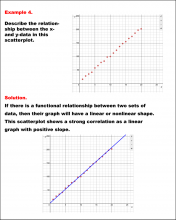
Math Example--Charts, Graphs, and Plots--Analyzing Scatterplots: Example 4 | Math Example--Charts, Graphs, and Plots-- Analyzing Scatterplots: Example 4
In this set of math examples, analyze the behavior of different scatterplots. This includes linear and quadratic models. |
Data Analysis |
|
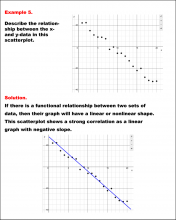
Math Example--Charts, Graphs, and Plots--Analyzing Scatterplots: Example 5 | Math Example--Charts, Graphs, and Plots-- Analyzing Scatterplots: Example 5
In this set of math examples, analyze the behavior of different scatterplots. This includes linear and quadratic models. |
Data Analysis |
|
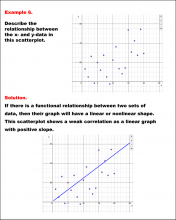
Math Example--Charts, Graphs, and Plots--Analyzing Scatterplots: Example 6 | Math Example--Charts, Graphs, and Plots-- Analyzing Scatterplots: Example 6
In this set of math examples, analyze the behavior of different scatterplots. This includes linear and quadratic models. |
Data Analysis |
|
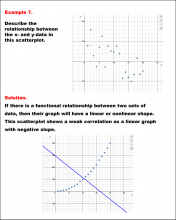
Math Example--Charts, Graphs, and Plots--Analyzing Scatterplots: Example 7 | Math Example--Charts, Graphs, and Plots-- Analyzing Scatterplots: Example 7
In this set of math examples, analyze the behavior of different scatterplots. This includes linear and quadratic models. |
Data Analysis |
|
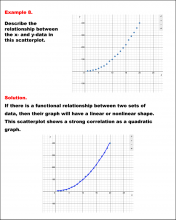
Math Example--Charts, Graphs, and Plots--Analyzing Scatterplots: Example 8 | Math Example--Charts, Graphs, and Plots-- Analyzing Scatterplots: Example 8
In this set of math examples, analyze the behavior of different scatterplots. This includes linear and quadratic models. |
Data Analysis |
|
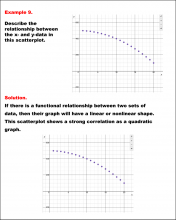
Math Example--Charts, Graphs, and Plots--Analyzing Scatterplots: Example 9 | Math Example--Charts, Graphs, and Plots-- Analyzing Scatterplots: Example 9
In this set of math examples, analyze the behavior of different scatterplots. This includes linear and quadratic models. |
Data Analysis |
|
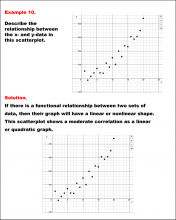
Math Example--Charts, Graphs, and Plots--Analyzing Scatterplots: Example 10 | Math Example--Charts, Graphs, and Plots-- Analyzing Scatterplots: Example 10
In this set of math examples, analyze the behavior of different scatterplots. This includes linear and quadratic models. |
Data Analysis |
|
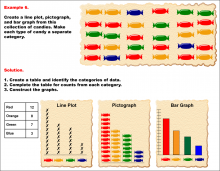
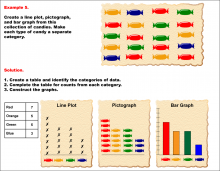
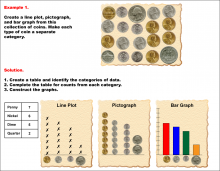
Math Example--Charts, Graphs, and Plots--Graphs of Categorical Data--Example 6 | Math Example--Charts, Graphs, and Plots-- Graphs of Categorical Data--Example 6
In this set of math examples, analyze the behavior of different scatterplots. This includes linear and quadratic models. |
Data Analysis |
|
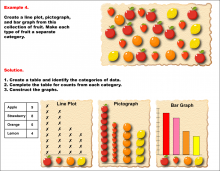
Math Example--Charts, Graphs, and Plots--Graphs of Categorical Data--Example 5 | Math Example--Charts, Graphs, and Plots-- Graphs of Categorical Data--Example 5
In this set of math examples, analyze the behavior of different scatterplots. This includes linear and quadratic models. |
Data Analysis |
|
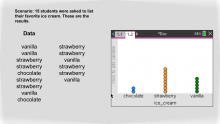
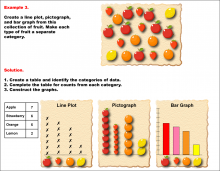
Math Example--Charts, Graphs, and Plots--Graphs of Categorical Data--Example 4 | Math Example--Charts, Graphs, and Plots-- Graphs of Categorical Data--Example 4
In this set of math examples, analyze the behavior of different scatterplots. This includes linear and quadratic models. |
Data Analysis |
|
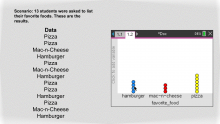
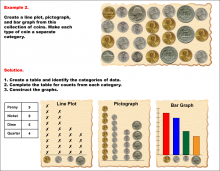
Math Example--Charts, Graphs, and Plots--Graphs of Categorical Data--Example 3 | Math Example--Charts, Graphs, and Plots-- Graphs of Categorical Data--Example 3
In this set of math examples, analyze the behavior of different scatterplots. This includes linear and quadratic models. |
Data Analysis |
|
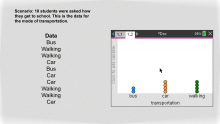
Math Example--Charts, Graphs, and Plots--Graphs of Categorical Data--Example 2 | Math Example--Charts, Graphs, and Plots-- Graphs of Categorical Data--Example 2
In this set of math examples, analyze the behavior of different scatterplots. This includes linear and quadratic models. |
Data Analysis |
|
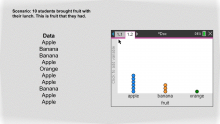
Math Example--Charts, Graphs, and Plots--Graphs of Categorical Data--Example 1 | Math Example--Charts, Graphs, and Plots-- Graphs of Categorical Data--Example 1
In this set of math examples, analyze the behavior of different scatterplots. This includes linear and quadratic models. |
Data Analysis |

|
Video Transcript: Measures of Central Tendency: The Mean and Normally Distributed Data | Video Transcript: Measures of Central Tendency: The Mean and Normally Distributed Data
This is the transcript for the video entitled, "Video Tutorial: Measures of Central Tendency: The Mean and Normally Distributed Data." This is part of a collection of video transcripts for the video tutorial series on Measures of Central Tendency. To see the complete collection of transcripts, click on this link. Note: The download is a PDF file. Video Transcript LibraryTo see the complete collection of video transcriptsy, click on this link. |
Data Analysis and Data Gathering |
|
Video Tutorial: Measures of Central Tendency: The Mean and Normally Distributed Data | Video Tutorial: Measures of Central Tendency: The Mean and Normally Distributed Data
TopicMeasures of Central Tendency DescriptionThis video examines the mean in normally distributed data, linking it to standard deviation and probabilities. Examples include batting averages, heights, and shoe sizes, emphasizing normal distribution properties. Key terms include mean, normal distribution, standard deviation, and probabilities. |
Data Analysis and Data Gathering |
|
|
Video Transcript: Measures of Central Tendency: Finding the Mode of a Data Set | Video Transcript: Measures of Central Tendency: Finding the Mode of a Data Set
This is the transcript for the video entitled, "Video Tutorial: Measures of Central Tendency: Finding the Mode of a Data Set." This is part of a collection of video transcripts for the video tutorial series on Measures of Central Tendency. To see the complete collection of transcripts, click on this link. Note: The download is a PDF file. Video Transcript LibraryTo see the complete collection of video transcriptsy, click on this link. |
Data Analysis and Data Gathering |
|
Video Tutorial: Measures of Central Tendency: Finding the Mode of a Data Set | Video Tutorial: Measures of Central Tendency: Finding the Mode of a Data Set
TopicMeasures of Central Tendency DescriptionThis section focuses on the mode, the most frequent value in a data set, and its applications in dice rolls, beverage ratings, and color preferences. It compares mode with mean and median, highlighting its utility in categorical data. Key terms include mode, frequency, and categorical data. |
Data Analysis and Data Gathering |
|
|
Video Transcript: Measures of Central Tendency: Finding the Median of a Data Set | Video Transcript: Measures of Central Tendency: Finding the Median of a Data Set
This is the transcript for the video entitled, "Video Tutorial: Measures of Central Tendency: Finding the Median of a Data Set." This is part of a collection of video transcripts for the video tutorial series on Measures of Central Tendency. To see the complete collection of transcripts, click on this link. Note: The download is a PDF file. Video Transcript LibraryTo see the complete collection of video transcriptsy, click on this link. |
Data Analysis and Data Gathering |

|
Video Tutorial: Measures of Central Tendency: Finding the Median of a Data Set | Video Tutorial: Measures of Central Tendency: Finding the Median of a Data Set
TopicMeasures of Central Tendency DescriptionThis segment discusses the median, another measure of central tendency, focusing on its calculation by ordering data and finding the middle value. Examples include test scores, basketball player heights, and family ages, highlighting scenarios where the median differs from the mean. Key terms include median, middle value, and ordering. |
Data Analysis and Data Gathering |
|
|
Video Transcript: Measures of Central Tendency: Finding the Mean of a Data Set II | Video Transcript: Measures of Central Tendency: Finding the Mean of a Data Set II
This is the transcript for the video entitled, "Video Tutorial: Measures of Central Tendency: Finding the Mean of a Data Set II." This is part of a collection of video transcripts for the video tutorial series on Measures of Central Tendency. To see the complete collection of transcripts, click on this link. Note: The download is a PDF file. Video Transcript LibraryTo see the complete collection of video transcriptsy, click on this link. |
Data Analysis and Data Gathering |

|
Video Tutorial: Measures of Central Tendency: Finding the Mean of a Data Set II | Video Tutorial: Measures of Central Tendency: Finding the Mean of a Data Set II
TopicMeasures of Central Tendency DescriptionThe video explores calculating the mean with data sets including negative numbers, like temperatures in Fairbanks and Fargo, and tide heights in Gloucester. It emphasizes the mean's robustness across varying data types and scenarios. Key terms include negative numbers, sum, and ratio. |
Data Analysis and Data Gathering |
|
|
Video Transcript: Measures of Central Tendency: Finding the Mean of a Data Set I | Video Transcript: Measures of Central Tendency: Finding the Mean of a Data Set I
This is the transcript for the video entitled, "Video Tutorial: Measures of Central Tendency: Finding the Mean of a Data Set I." This is part of a collection of video transcripts for the video tutorial series on Measures of Central Tendency. To see the complete collection of transcripts, click on this link. Note: The download is a PDF file. Video Transcript LibraryTo see the complete collection of video transcriptsy, click on this link. |
Data Analysis and Data Gathering |

|
Video Tutorial: Measures of Central Tendency: Finding the Mean of a Data Set I | Video Tutorial: Measures of Central Tendency: Finding the Mean of a Data Set I
TopicMeasures of Central Tendency DescriptionThis video introduces the mean as a measure of central tendency, explaining it as the sum of values divided by their count. Examples include calculating test scores, flamingo wingspans, and football punt lengths, demonstrating how the mean is applied to summarize data. Key terms include mean, average, sum, and ratio. |
Data Analysis and Data Gathering |
|
|
Video Transcript: Place Value: Organizing Data Using Place Value | Video Transcript: Place Value: Organizing Data Using Place Value
This is the transcript for the video entitled "Video Tutorial: Place Value: Organizing Data Using Place Value." This is part of a collection of video transcripts for the video tutorial series on Place Value. To see the complete collection of transcripts, click on this link. Note: The download is a PDF file. Video Transcript LibraryTo see the complete collection of video transcriptsy, click on this link. |
Place Value |
|
Video Tutorial: Place Value: Organizing Data Using Place Value | Video Tutorial: Place Value: Organizing Data Using Place Value
TopicPlace Value DescriptionThis video demonstrates using place value to sort and arrange data numerically. Concepts include organizing numerical data in ascending or descending order based on digit values in ones, tens, and tenths places. Vocabulary includes terms like numerical order, ascending, and descending. Applications involve real-world data sets, such as precipitation amounts and planetary gravity data. The process emphasizes sequential sorting, starting from the highest place value to ensure correct order, particularly when digits repeat in lower place values. |
Place Value |
|
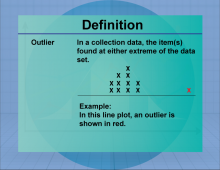
Definition--Measures of Central Tendency--Outlier | OutlierTopicStatistics DefinitionThe outlier is is an extreme value for a data set. DescriptionThe Outlier is an important concept in statistics. While it doesn't represent the average data set, it does set the range of extreme values in the data set. An outlier can be extremely large or small. In mathematics education, understanding outlier is crucial as it lays the foundation for more advanced statistical concepts. It allows students to grasp the significance of data analysis and interpretation. In classes, students often perform exercises calculating the mean of sets, which enhances their understanding of averaging techniques. |
Data Analysis |
|
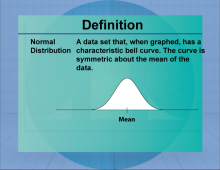
Definition--Measures of Central Tendency--Normal Distribution | Normal DistributionTopicStatistics DefinitionThe normal distribution is a measure of central tendency that provides an average representation of a set of data. DescriptionThe Normal Distribution is an important concept in statistics, used to summarize data effectively. In real-world applications, the Normal Distribution helps to interpret data distributions and is widely used in areas such as economics, social sciences, and research. |
Data Analysis |
|
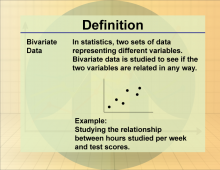
Definition--Statistics and Probability Concepts--Bivariate Data | Bivariate DataTopicStatistics and Probability DefinitionBivariate data involves the analysis of two variables to determine relationships between them. DescriptionBivariate data is essential in statistics as it allows for the exploration of relationships between two variables, such as height and weight. This analysis is used in various fields, including economics, biology, and social sciences, to understand correlations and causations. For example, a scatter plot can be used to visually represent bivariate data, helping to identify trends or patterns. |
Data Analysis |
|
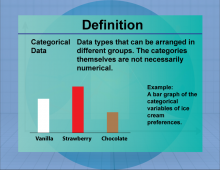
Definition--Measures of Central Tendency--Categorical Data | Categorical DataTopicStatistics DefinitionCategorical data refers to data that can be divided into specific categories or groups. DescriptionCategorical data is essential for organizing and analyzing information that falls into distinct categories, such as gender, race, or product type. This type of data is often used in market research, social sciences, and public health studies to identify patterns and relationships between groups. In mathematics, understanding categorical data is crucial for interpreting bar charts, pie charts, and frequency tables. |
Data Analysis |
|
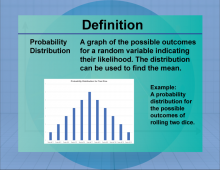
Definition--Measures of Central Tendency--Probability Distribution | Probability DistributionTopicStatistics DefinitionA probability distribution describes how the values of a random variable are distributed. DescriptionProbability distributions are fundamental in statistics, providing a mathematical function that gives the probabilities of occurrence of different possible outcomes for an experiment. They are used in various fields such as finance, science, and engineering to model uncertainty and variability. For instance, the normal distribution is a common probability distribution that describes many natural phenomena. |
Data Analysis |
|
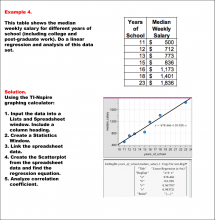
Math Example--Linear Function Concepts--Linear Data Model: Example 4 | Math Example--Linear Function Concepts--Linear Data Model: Example 4TopicLinear Functions |
Data Analysis |
|
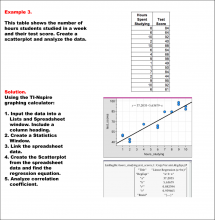
Math Example--Linear Function Concepts--Linear Data Model: Example 3 | Math Example--Linear Function Concepts--Linear Data Model: Example 3TopicLinear Functions |
Data Analysis |
|
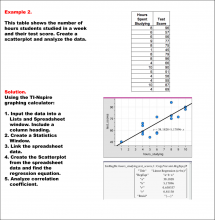
Math Example--Linear Function Concepts--Linear Data Model: Example 2 | Math Example--Linear Function Concepts--Linear Data Model: Example 2TopicLinear Functions |
Data Analysis |
|
Math Example--Linear Function Concepts--Linear Data Model: Example 1 | Math Example--Linear Function Concepts--Linear Data Model: Example 1TopicLinear Functions |
Data Analysis |
|
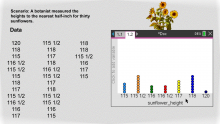
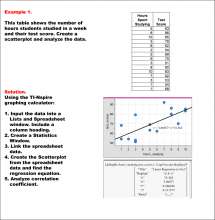
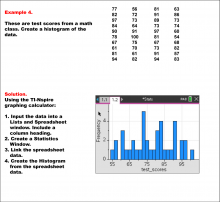
Math Example--Charts, Graphs, and Plots--Data Plot--Example 4 | Math Example--Charts, Graphs, and Plots-- Data Plot--Example 4
In this set of math examples, analyze the behavior of different scatterplots. This includes linear and quadratic models. |
Data Analysis |
|
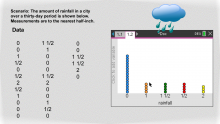
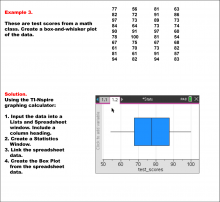
Math Example--Charts, Graphs, and Plots--Data Plot--Example 3 | Math Example--Charts, Graphs, and Plots-- Data Plot--Example 3
In this set of math examples, analyze the behavior of different scatterplots. This includes linear and quadratic models. |
Data Analysis |