
Illustrative Math Alignment: Grade 6 Unit 8
Data Sets and Distributions
Lesson 18: Using Data to Solve Problems
Use the following Media4Math resources with this Illustrative Math lesson.
| Thumbnail Image | Title | Body | Curriculum Nodes |
|---|---|---|---|
|
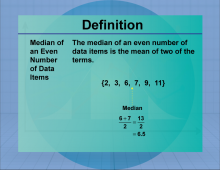
Definition--Measures of Central Tendency--Median of an Even Data Set | Median of an Even Data SetTopicStatistics DefinitionThe median of an even data set is the mean of two of the terms. DescriptionThe Median is the middle term of a data set. If the data set consists of an even number of terms, then the Median won't be one of ther terms in the set. In such a case the Median is the Mean of the two middle terms. |
Data Analysis |
|
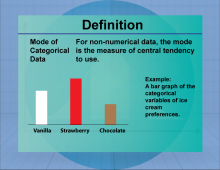
Definition--Measures of Central Tendency--Mode of Categorical Data | Mode of Categorical DataTopicStatistics DefinitionThe mode of categorical data is the most frequent item in a categorical data set. DescriptionThe Mode of Categorical Data is useful for finding the most frequent data item used with non-numerical data. For example, preferences for discrete characteristics can result in a mode. |
Data Analysis |
|
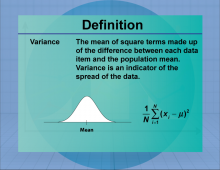
Definition--Measures of Central Tendency--Variance | VarianceTopicStatistics DefinitionVariance is a measure of the dispersion of a set of values, calculated as the average of the squared deviations from the mean. DescriptionVariance quantifies the degree of spread in a data set, providing insight into the variability of data points around the mean. It is a fundamental concept in statistics, used in fields such as finance, research, and engineering to assess risk and variability. A high variance indicates greater dispersion, while a low variance suggests that data points are closer to the mean. |
Data Analysis |
|
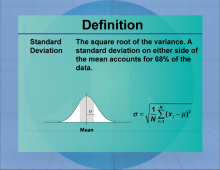
Definition--Measures of Central Tendency--Standard Deviation | Standard DeviationTopicStatistics DefinitionStandard deviation is a measure of the amount of variation or dispersion in a set of values. DescriptionStandard deviation quantifies the degree of variation in a data set, indicating how much individual data points deviate from the mean. It is a crucial statistic for understanding the spread of data and is widely used in fields such as finance, research, and quality control to assess variability and risk. A low standard deviation indicates that data points are close to the mean, while a high standard deviation suggests greater variability. |
Data Analysis |
|
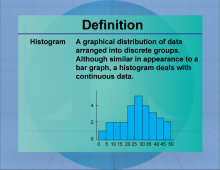
Definition--Measures of Central Tendency--Histogram | HistogramTopicStatistics DefinitionA histogram is a graphical representation of data distribution using bars of different heights. DescriptionHistograms are used to visualize the frequency distribution of continuous data, making it easier to identify patterns and trends. They are widely used in fields such as economics, biology, and engineering to analyze data distributions and detect anomalies. In mathematics, histograms are essential for understanding probability distributions and statistical inference. |
Data Analysis |
|
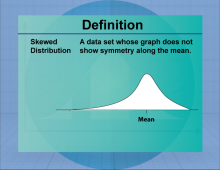
Definition--Measures of Central Tendency--Skewed Distribution | Skewed DistributionTopicStatistics DefinitionA skewed distribution is a probability distribution that is not symmetric, with data tending to cluster more on one side. DescriptionSkewed distributions occur when data is not evenly distributed around the mean, resulting in a longer tail on one side. Skewness can be positive (right-skewed) or negative (left-skewed), affecting the interpretation of data and statistical measures such as the mean and median. Skewed distributions are common in real-world data, such as income levels and test scores, where extreme values can influence the overall distribution. |
Data Analysis |
|
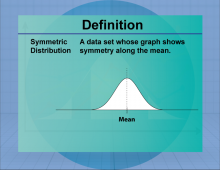
Definition--Measures of Central Tendency--Symmetric Distribution | Symmetric DistributionTopicStatistics DefinitionA symmetric distribution is a probability distribution where the left and right sides are mirror images of each other. DescriptionSymmetric distributions are characterized by data that is evenly distributed around the mean, resulting in a balanced, mirror-image shape. The most common symmetric distribution is the normal distribution, which is widely used in statistics for modeling natural phenomena. Symmetric distributions are important for statistical inference, as many statistical tests assume data is symmetrically distributed. |
Data Analysis |
|
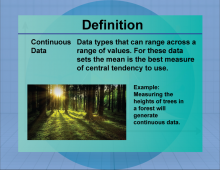
Definition--Measures of Central Tendency--Continuous Data | Continuous DataTopicStatistics DefinitionContinuous data is numerical data that can take any value within a range. DescriptionContinuous data is vital for representing measurements such as height, weight, and temperature, which can assume an infinite number of values within a given range. In real-world applications, continuous data is used in fields like engineering, physics, and economics to model and predict outcomes. Understanding continuous data is essential for performing calculations involving integrals and derivatives in calculus. |
Data Analysis |
|
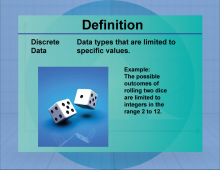
Definition--Measures of Central Tendency--Discrete Data | Discrete DataTopicStatistics DefinitionDiscrete data consists of countable values, often represented by whole numbers. DescriptionDiscrete data is commonly used in situations where data points are distinct and separate, such as the number of students in a class or the number of cars in a parking lot. It is crucial for fields like computer science, where discrete structures and algorithms are fundamental. In mathematics, discrete data is used in probability theory and combinatorics, helping to solve problems involving permutations and combinations. |
Data Analysis |

|
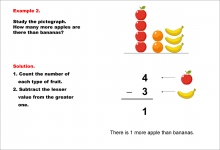
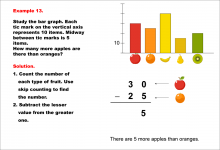
Math Example--Charts, Graphs, and Plots--Reading and Interpreting Scaled Graphs--Example 1 | Math Example--Charts, Graphs, and Plots-- Reading and Interpreting Scaled Graphs--Example 1
In this set of math examples, analyze the behavior of different scatterplots. This includes linear and quadratic models. |
Subtraction Facts to 100 and Data Analysis |
|
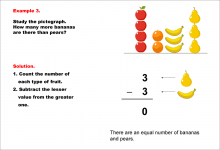
Math Example--Charts, Graphs, and Plots--Reading and Interpreting Scaled Graphs--Example 2 | Math Example--Charts, Graphs, and Plots-- Reading and Interpreting Scaled Graphs--Example 2
In this set of math examples, analyze the behavior of different scatterplots. This includes linear and quadratic models. |
Subtraction Facts to 100 and Data Analysis |
|
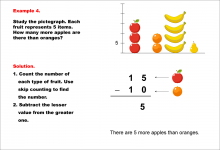
Math Example--Charts, Graphs, and Plots--Reading and Interpreting Scaled Graphs--Example 3 | Math Example--Charts, Graphs, and Plots-- Reading and Interpreting Scaled Graphs--Example 3
In this set of math examples, analyze the behavior of different scatterplots. This includes linear and quadratic models. |
Subtraction Facts to 100 and Data Analysis |
|
Math Example--Charts, Graphs, and Plots--Reading and Interpreting Scaled Graphs--Example 4 | Math Example--Charts, Graphs, and Plots-- Reading and Interpreting Scaled Graphs--Example 4
In this set of math examples, analyze the behavior of different scatterplots. This includes linear and quadratic models. |
Subtraction Facts to 100 and Data Analysis |
|
Math Example--Charts, Graphs, and Plots--Reading and Interpreting Scaled Graphs--Example 5 | Math Example--Charts, Graphs, and Plots-- Reading and Interpreting Scaled Graphs--Example 5
In this set of math examples, analyze the behavior of different scatterplots. This includes linear and quadratic models. |
Subtraction Facts to 100 and Data Analysis |
|
Math Example--Charts, Graphs, and Plots--Reading and Interpreting Scaled Graphs--Example 6 | Math Example--Charts, Graphs, and Plots-- Reading and Interpreting Scaled Graphs--Example 6
In this set of math examples, analyze the behavior of different scatterplots. This includes linear and quadratic models. |
Subtraction Facts to 100 and Data Analysis |
|
Math Example--Charts, Graphs, and Plots--Reading and Interpreting Scaled Graphs--Example 7 | Math Example--Charts, Graphs, and Plots-- Reading and Interpreting Scaled Graphs--Example 7
In this set of math examples, analyze the behavior of different scatterplots. This includes linear and quadratic models. |
Subtraction Facts to 100 and Data Analysis |
|
Math Example--Charts, Graphs, and Plots--Reading and Interpreting Scaled Graphs--Example 8 | Math Example--Charts, Graphs, and Plots-- Reading and Interpreting Scaled Graphs--Example 8
In this set of math examples, analyze the behavior of different scatterplots. This includes linear and quadratic models. |
Subtraction Facts to 100 and Data Analysis |
|
Math Example--Charts, Graphs, and Plots--Reading and Interpreting Scaled Graphs--Example 9 | Math Example--Charts, Graphs, and Plots-- Reading and Interpreting Scaled Graphs--Example 9
In this set of math examples, analyze the behavior of different scatterplots. This includes linear and quadratic models. |
Subtraction Facts to 100 and Data Analysis |
|
Math Example--Charts, Graphs, and Plots--Reading and Interpreting Scaled Graphs--Example 10 | Math Example--Charts, Graphs, and Plots-- Reading and Interpreting Scaled Graphs--Example 10
In this set of math examples, analyze the behavior of different scatterplots. This includes linear and quadratic models. |
Subtraction Facts to 100 and Data Analysis |
|
Math Example--Charts, Graphs, and Plots--Reading and Interpreting Scaled Graphs--Example 11 | Math Example--Charts, Graphs, and Plots-- Reading and Interpreting Scaled Graphs--Example 11
In this set of math examples, analyze the behavior of different scatterplots. This includes linear and quadratic models. |
Subtraction Facts to 100 and Data Analysis |
|
Math Example--Charts, Graphs, and Plots--Reading and Interpreting Scaled Graphs--Example 12 | Math Example--Charts, Graphs, and Plots-- Reading and Interpreting Scaled Graphs--Example 12
In this set of math examples, analyze the behavior of different scatterplots. This includes linear and quadratic models. |
Subtraction Facts to 100 and Data Analysis |
|
Math Example--Charts, Graphs, and Plots--Reading and Interpreting Scaled Graphs--Example 13 | Math Example--Charts, Graphs, and Plots-- Reading and Interpreting Scaled Graphs--Example 13
In this set of math examples, analyze the behavior of different scatterplots. This includes linear and quadratic models. |
Subtraction Facts to 100 and Data Analysis |
|
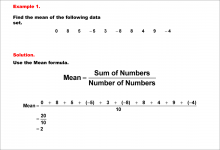
Math Example--Measures of Central Tendency--Mean of Data That Includes Negative Numbers--Example 1 | Math Example--Measures of Central Tendency--Mean of Data That Includes Negative Numbers--Example 1TopicMeasures of Central Tendency DescriptionThis math example demonstrates the calculation of the mean for a data set that includes negative numbers: 0, 8, 5, -5, 3, -8, 8, 4, 9, -4. The example emphasizes the step-by-step process of finding the mean, showing how to handle both positive and negative values in the calculation. |
Data Analysis |

|
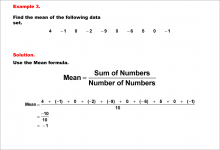
Math Example--Measures of Central Tendency--Mean of Data That Includes Negative Numbers--Example 2 | Math Example--Measures of Central Tendency--Mean of Data That Includes Negative Numbers--Example 2TopicMeasures of Central Tendency DescriptionThis example illustrates the calculation of the mean for a dataset containing both positive and negative numbers: 7, 4, 1, 1, -1, -2, 9, 4, -9, -4. The step-by-step process shows how to sum all values, including negative ones, and divide by the total number of data points to find the mean. |
Data Analysis |
|
Math Example--Measures of Central Tendency--Mean of Data That Includes Negative Numbers--Example 3 | Math Example--Measures of Central Tendency--Mean of Data That Includes Negative Numbers--Example 3TopicMeasures of Central Tendency DescriptionThis example demonstrates the calculation of the mean for a dataset that includes negative numbers and zeros: 4, -1, 0, -2, -9, 0, -6, 5, 0, -1. The step-by-step process illustrates how to sum all values, including negatives and zeros, and divide by the total number of data points to determine the mean. |
Data Analysis |

|
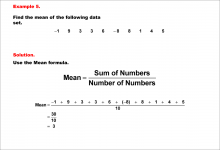
Math Example--Measures of Central Tendency--Mean of Data That Includes Negative Numbers--Example 4 | Math Example--Measures of Central Tendency--Mean of Data That Includes Negative Numbers--Example 4TopicMeasures of Central Tendency DescriptionThis example illustrates the calculation of the mean for a dataset containing both positive and negative numbers: -3, 8, 2, 1, 3, -6, -9, 3, -4. The step-by-step process demonstrates how to sum all values, including negative ones, and divide by the total number of data points to find the mean. |
Data Analysis |
|
Math Example--Measures of Central Tendency--Mean of Data That Includes Negative Numbers--Example 5 | Math Example--Measures of Central Tendency--Mean of Data That Includes Negative Numbers--Example 5TopicMeasures of Central Tendency DescriptionThis example demonstrates the calculation of the mean for a dataset that includes both positive and negative numbers: -1, 9, 3, 3, 6, -8, 8, 1, 4, 5. The step-by-step process shows how to sum all values, including negative ones, and divide by the total number of data points to determine the mean. |
Data Analysis |
|
Math Example--Measures of Central Tendency--Mean of Data That Includes Negative Numbers--Example 6 | Math Example--Measures of Central Tendency--Mean of Data That Includes Negative Numbers--Example 6TopicMeasures of Central Tendency DescriptionThis example illustrates the calculation of the mean for a dataset containing both positive and negative numbers: -4, -5, 6, 2, 5, 7, 9, 9, -9, 5. The step-by-step process demonstrates how to sum all values, including negative ones, and divide by the total number of data points to find the mean. |
Data Analysis |

|
Math Example--Measures of Central Tendency--Mean of Data That Includes Negative Numbers--Example 7 | Math Example--Measures of Central Tendency--Mean of Data That Includes Negative Numbers--Example 7TopicMeasures of Central Tendency DescriptionThis example demonstrates the calculation of the mean for a dataset that includes negative numbers and zero: -4, 0, 2, 9, -2, -3, -5, 10, -7, 5. The step-by-step process illustrates how to sum all values, including negatives and zero, and divide by the total number of data points to determine the mean. |
Data Analysis |

|
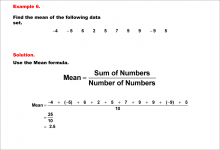
Math Example--Measures of Central Tendency--Mean of Data That Includes Negative Numbers--Example 8 | Math Example--Measures of Central Tendency--Mean of Data That Includes Negative Numbers--Example 8TopicMeasures of Central Tendency DescriptionThis image shows a math example calculating the mean of a data set. The numbers are: 4, 8, -6, -6, 6, -3, 4, -8, -6, -8. The solution uses the mean formula. Example 8 demonstrates finding the mean of the data set. The mean is calculated by summing all numbers and dividing by the count of numbers, resulting in (-15) / (10) = -1.5. |
Data Analysis |

|
Math Example--Measures of Central Tendency--Mean of Data That Includes Negative Numbers--Example 9 | Math Example--Measures of Central Tendency--Mean of Data That Includes Negative Numbers--Example 9TopicMeasures of Central Tendency DescriptionThe image shows Example 9, illustrating how to find the mean of a data set using the mean formula. This example demonstrates finding the mean of the data set: -8, -9, 10, -2, 3, -2, -8, -3, 2, 5. The calculation is shown step-by-step: Mean = Sum / Count. The sum of all numbers (-8 + (-9) + 10 + (-2) + 3 + (-2) + (-8) + (-3) + 2 + 5) is divided by the count of numbers (10), resulting in -12 / 10 = -1.2. |
Data Analysis |
|
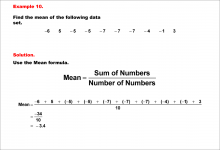
Math Example--Measures of Central Tendency--Mean of Data That Includes Negative Numbers--Example 10 | Math Example--Measures of Central Tendency--Mean of Data That Includes Negative Numbers--Example 10TopicMeasures of Central Tendency DescriptionThe image shows Example 10, demonstrating how to calculate the mean for a different set of numbers. This example illustrates finding the mean of the data set: -6, 5, -5, -5, -7, -7, -4, -1, 3. The calculation is presented step-by-step: Mean = Sum / Count. The sum of all numbers (-6 + 5 + (-5) + (-5) + (-7) + (-7) + (-4) + (-1) + 3) is divided by the count of numbers (10), resulting in -34 / 10 = -3.4. |
Data Analysis |
|
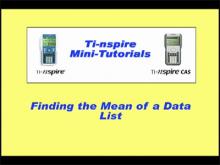
Closed Captioned Video: Mean of a Data List | Closed Captioned Video: Mean of a Data List
In this TI Nspire tutorial, the Spreadsheet and Calculator windows are used to find the mean of a data list. This video supports the TI-Nspire Clickpad and Touchpad. This Mini-Tutorial Video includes a worksheet. . |
Data Analysis |
|
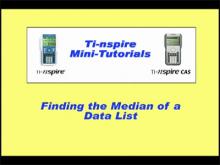
Closed Captioned Video: Median of a Data List | Closed Captioned Video: Median of a Data List
In this TI Nspire tutorial, the Spreadsheet and Calculator windows are used to find the median of a data list. This video supports the TI-Nspire Clickpad and Touchpad. This Mini-Tutorial Video includes a worksheet. . |
Data Analysis |

|
Video Transcript: TI-Nspire Mini-Tutorial: Finding the Mean of a Data List | Video Transcript: TI-Nspire Mini-Tutorial: Finding the Mean of a Data List
This is the transcript for the TI-Nspire Mini-Tutorial entitled, Finding the Mean of a Data List. This is part of a collection of video transcripts for the video tutorial series on using the TI-Nspire Graphing Calculator. To see the complete collection of transcripts, click on this link. Note: The download is a PDF file. Video Transcript LibraryTo see the complete collection of video transcriptsy, click on this link. |
Data Analysis |
|
|
Video Transcript: TI-Nspire Mini-Tutorial: Finding the Median of a Data List | Video Transcript: TI-Nspire Mini-Tutorial: Finding the Median of a Data List
This is the transcript for the TI-Nspire Mini-Tutorial entitled, Finding the Median of a Data List. This is part of a collection of video transcripts for the video tutorial series on using the TI-Nspire Graphing Calculator. To see the complete collection of transcripts, click on this link. Note: The download is a PDF file. Video Transcript LibraryTo see the complete collection of video transcriptsy, click on this link. |
Data Analysis |
|
Closed Captioned Video: Algebra Nspirations: Data Analysis and Probability, 3 | Closed Captioned Video: Algebra Nspirations: Data Analysis and Probability, Segment 3
In this Investigation we look at real-world data involving endangered wolf populations. This video is Segment 3 of a 4 segment series related to Data Analysis and Probability. Segments 3 and 4 are grouped together. |
Data Analysis and Data Gathering |
|
Closed Captioned Video: Algebra Nspirations: Data Analysis and Probability, 1 | Closed Captioned Video: Algebra Nspirations: Data Analysis and Probability, Segment 1
In this Investigation we explore uncertainty and randomness. This video is Segment 1 of a 4 segment series related to Data Analysis and Probability. Segments 1 and 2 are grouped together. |
Data Analysis and Data Gathering |
|
Closed Captioned Video: Algebra Nspirations: Data Analysis and Probability | Closed Captioned Video: Algebra Nspirations: Data Analysis and Probability
What are the two meanings of statistics? What does it really mean that an event has a 50% probability of occurring? Why are data analysis and probability always taught together? Written and hosted by internationally acclaimed math educator Dr. Monica Neagoy, this video answers these questions and addresses fundamental concepts such as the law of large numbers and the notion of regression analysis. Both engaging investigations are based on true stories and real data, utilize different Nspire applications, and model the seamless connection among various problem representations. Concepts explored: statistics, data analysis, regression analysis. |
Data Analysis and Data Gathering |

|
Closed Captioned Video: Algebra Applications: Linear Functions, 3 | Closed Captioned Video: Algebra Applications: Linear Functions, 3TopicLinear Functions DescriptionUses linear regression to analyze US oil consumption trends, projecting future usage and potential impact of Alaskan oil production. This video explores the mathematics behind Linear Functions, providing clear examples and engaging visuals to enhance understanding. It is an excellent resource for both introduction and reinforcement of key concepts. |
Special Functions and Applications of Linear Functions |
|
Closed Captioned Video: Algebra Applications: Data Analysis, 4 | Closed Captioned Video: Algebra Applications: Data Analysis, 4TopicData Analysis DescriptionAdjustable-rate mortgages (ARMs) are discussed, focusing on their role in the 2008 crisis. It demonstrates how variable rates increase long-term costs and create financial risks. Concepts include loan balance, refinancing, and amortization. The video uses spreadsheets to show payment changes over time and their economic effects. Applications highlight real-world implications of rising interest rates and decreasing home values. |
Data Analysis and Data Gathering |
|
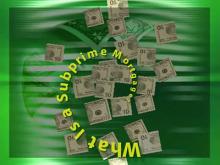
Closed Captioned Video: Algebra Applications: Data Analysis, 3 | Closed Captioned Video: Algebra Applications: Data Analysis, 3TopicData Analysis DescriptionThis segment explains subprime mortgages, emphasizing how credit scores affect loan interest rates. It compares repayment scenarios for borrowers with different FICO scores, showing the financial challenges of subprime loans. Key terms include subprime mortgage, credit risk, and delinquency. The video uses simulations to illustrate the likelihood and impact of loan defaults, linking these trends to the mortgage crisis. |
Data Analysis and Data Gathering |

|
Closed Captioned Video: Algebra Applications: Data Analysis, 2 | Closed Captioned Video: Algebra Applications: Data Analysis, 2TopicData Analysis DescriptionThe video defines a mortgage as a long-term loan used to purchase a home and explains its components: loan amount, interest rate, and payment periods. Through examples, it demonstrates how interest rates impact total loan costs. Key concepts include amortization, equity, and principal versus interest payments. Applications involve using financial calculators to analyze repayment schedules and equity growth, emphasizing the importance of interest rates. |
Data Analysis and Data Gathering |

|
Closed Captioned Video: Algebra Applications: Data Analysis, 1 | Closed Captioned Video: Algebra Applications: Data Analysis, 1TopicData Analysis DescriptionThis segment introduces the 2008 mortgage crisis, explaining how mortgage defaults caused widespread economic repercussions, including a recession. It outlines basic mortgage concepts such as loan amount, interest rate, and repayment periods. Key terms include mortgage, interest rate, and amortization. The segment sets the stage for exploring how specific mortgage types, like subprime loans, led to financial instability. |
Data Analysis and Data Gathering |
|
Closed Captioned Video: Algebra Applications: Data Analysis | Closed Captioned Video: Algebra Applications: Data AnalysisTopicData Analysis |
Data Analysis and Data Gathering |
|
Closed Captioned Video: Ratios and Rates: Rates from Data | Closed Captioned Video: Ratios and Rates: Rates from DataTopicRatios DescriptionThis video demonstrates calculating rates from data sets, focusing on patterns like distance-time relationships and wages. Examples include determining car speeds, hourly wages, and unit costs of gasoline. Data tables are used to visualize and compute rates. |
Ratios and Rates |
|
Closed Captioned Video: Measures of Central Tendency: The Mean and Normally Distributed Data | Closed Captioned Video: Measures of Central Tendency: The Mean and Normally Distributed Data
In this video tutorial students learn about normally distributed data and how to identify the population mean from the normal distribution. Standard deviation is briefly introduced. Includes three real-world examples. |
Data Analysis and Data Gathering |
|
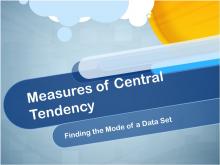
Closed Captioned Video: Measures of Central Tendency: Finding the Mode of a Data Set | Closed Captioned Video: Measures of Central Tendency: Finding the Mode of a Data Set
In this video tutorial students learn how to calculate the mode of a data set, as well as how the mode differs from the mean and median.Includes three real-world examples. |
Data Analysis and Data Gathering |

|
Closed Captioned Video: Measures of Central Tendency: Finding the Median of a Data Set | Closed Captioned Video: Measures of Central Tendency: Finding the Median of a Data Set
In this video tutorial students learn how to find the median of a data set. The mean is also calculated so that students can learn similarities and differences between these two measures of central tendency. Includes three real-world examples. |
Data Analysis and Data Gathering |
|
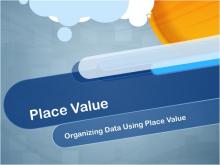
Closed Captioned Video: Place Value: Organizing Data Using Place Value | Closed Captioned Video: Place Value: Organizing Data Using Place Value
In this tutorial, students arrange decimal data using place value techniques. |
Place Value |