
Illustrative Math Alignment: Grade 7 Unit 8
Probability and Sampling
Lesson 20: Memory Test
Use the following Media4Math resources with this Illustrative Math lesson.
| Thumbnail Image | Title | Body | Curriculum Topic |
|---|---|---|---|

|
Math Clip Art--Applications of Ratios--Zoo Animals 7 | Math Clip Art--Applications of Ratios--Zoo Animals 7 This is a collection of clip art images that show different ratios based on zoo animal populations. |
Ratios and Rates |
|
Math Clip Art--Applications of Ratios--Zoo Animals 8 | Math Clip Art--Applications of Ratios--Zoo Animals 8 This is a collection of clip art images that show different ratios based on zoo animal populations. |
Ratios and Rates |
|
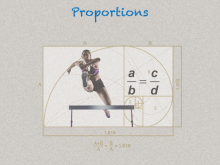
Math Clip Art--Ratios, Proportions, Percents--Proportions 01 | Math Clip Art--Ratios, Proportions, Percents--Proportions 01TopicRatios, Proportions, and Percents DescriptionThis image showcases the concept of proportions using a dynamic visual of a runner in action framed within a golden ratio spiral. The proportion is represented algebraically as a/b = c/d, linking visual and mathematical representations. It introduces proportions conceptually and visually, setting the foundation for the subsequent examples. |
Proportions |
|
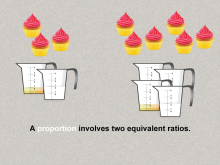
Math Clip Art--Ratios, Proportions, Percents--Proportions 02 | Math Clip Art--Ratios, Proportions, Percents--Proportions 02TopicRatios, Proportions, and Percents DescriptionThis image illustrates proportions using two equivalent ratios, represented by measuring cups and cupcakes. It simplifies proportions to relatable everyday examples. It connects proportions to practical examples, emphasizing the real-world relevance. Proportions are a foundational concept in mathematics, connecting ratios to real-world applications. Examples like those in this collection help students visualize and reason about proportional relationships in meaningful contexts, solidifying their understanding. |
Proportions |
|
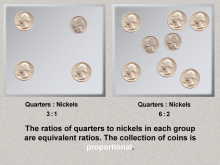
Math Clip Art--Ratios, Proportions, Percents--Proportions 03 | Math Clip Art--Ratios, Proportions, Percents--Proportions 03TopicRatios, Proportions, and Percents DescriptionThis image uses coins to demonstrate proportions. The image compares groups of quarters and nickels to highlight equivalent ratios (3:1 and 6:2). It solidifies the concept of equivalent ratios through another real-life example, reinforcing the idea. Proportions are a foundational concept in mathematics, connecting ratios to real-world applications. Examples like those in this collection help students visualize and reason about proportional relationships in meaningful contexts, solidifying their understanding. |
Proportions |
|
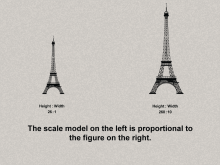
Math Clip Art--Ratios, Proportions, Percents--Proportions 04 | Math Clip Art--Ratios, Proportions, Percents--Proportions 04TopicRatios, Proportions, and Percents DescriptionThis image demonstrates proportions through a scale model example, comparing the height and width ratios of the Eiffel Tower in two scales. It highlights the application of proportions in scaling and models, bridging abstract and practical understanding. Proportions are a foundational concept in mathematics, connecting ratios to real-world applications. Examples like those in this collection help students visualize and reason about proportional relationships in meaningful contexts, solidifying their understanding. |
Proportions |
|
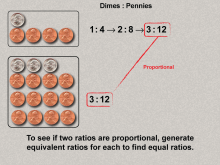
Math Clip Art--Ratios, Proportions, Percents--Proportions 05 | Math Clip Art--Ratios, Proportions, Percents--Proportions 05TopicRatios, Proportions, and Percents DescriptionThis image shows proportionality between dimes and pennies using equivalent ratios (1:4 and 3:12). Mathematical steps verify proportionality. It introduces proportional reasoning and calculation steps to ensure clarity in identifying proportional relationships. Proportions are a foundational concept in mathematics, connecting ratios to real-world applications. Examples like those in this collection help students visualize and reason about proportional relationships in meaningful contexts, solidifying their understanding. |
Proportions |

|
Math Clip Art--Ratios, Proportions, Percents--Proportions 06 | Math Clip Art--Ratios, Proportions, Percents--Proportions 06TopicRatios, Proportions, and Percents DescriptionThis image presents proportional triangles, with side lengths maintaining equivalent ratios (2:3:4 and 6:9:12). It demonstrates geometric applications of proportions, extending the concept to shapes and measurements. Proportions are a foundational concept in mathematics, connecting ratios to real-world applications. Examples like those in this collection help students visualize and reason about proportional relationships in meaningful contexts, solidifying their understanding. |
Proportions |
|
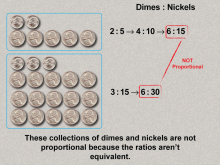
Math Clip Art--Ratios, Proportions, Percents--Proportions 07 | Math Clip Art--Ratios, Proportions, Percents--Proportions 07TopicRatios, Proportions, and Percents DescriptionThis image contrasts proportionality with non-proportional groups of coins (dimes and nickels). Ratios differ, clarifying when proportions do not exist. It explains non-proportionality to deepen understanding of proportional relationships. Proportions are a foundational concept in mathematics, connecting ratios to real-world applications. Examples like those in this collection help students visualize and reason about proportional relationships in meaningful contexts, solidifying their understanding. |
Proportions |
|
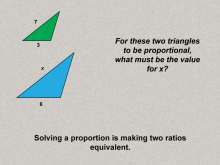
Math Clip Art--Ratios, Proportions, Percents--Proportions 08 | Math Clip Art--Ratios, Proportions, Percents--Proportions 08TopicRatios, Proportions, and Percents DescriptionThis image poses a question about proportional triangles, asking for the missing value (x) to maintain proportionality. It introduces problem-solving involving proportions, encouraging engagement and application. Proportions are a foundational concept in mathematics, connecting ratios to real-world applications. Examples like those in this collection help students visualize and reason about proportional relationships in meaningful contexts, solidifying their understanding. |
Proportions |
|
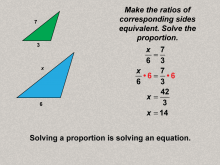
Math Clip Art--Ratios, Proportions, Percents--Proportions 09 | Math Clip Art--Ratios, Proportions, Percents--Proportions 09TopicRatios, Proportions, and Percents DescriptionThis image solves the posed proportion problem by finding the value of x using equivalent ratios (x/6 = 7/3). It breaks down the process of solving proportions, reinforcing mathematical reasoning. Proportions are a foundational concept in mathematics, connecting ratios to real-world applications. Examples like those in this collection help students visualize and reason about proportional relationships in meaningful contexts, solidifying their understanding. |
Proportions |
|
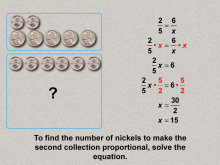
Math Clip Art--Ratios, Proportions, Percents--Proportions 10 | Math Clip Art--Ratios, Proportions, Percents--Proportions 10TopicRatios, Proportions, and Percents DescriptionThis image demonstrates proportionality in coins by calculating the number of nickels required for proportional groups (2/5 = 6/x). It closes the sequence with a real-world problem, consolidating the topic and providing a practical application. Proportions are a foundational concept in mathematics, connecting ratios to real-world applications. Examples like those in this collection help students visualize and reason about proportional relationships in meaningful contexts, solidifying their understanding. |
Proportions |
|
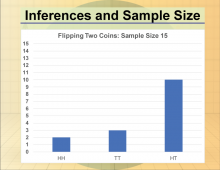
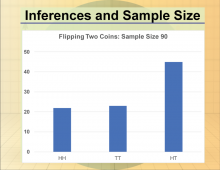
Math Clip Art--Statistics and Probability-- Inferences and Sample Size--10 | Math Clip Art--Statistics and Probability-- Inferences and Sample Size--10
This is part of a collection of math clip art images that show different statistical graphs and concepts, along with some probability concepts. |
Data Gathering |
|
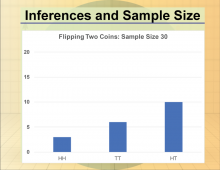
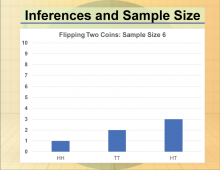
Math Clip Art--Statistics and Probability-- Inferences and Sample Size--11 | Math Clip Art--Statistics and Probability-- Inferences and Sample Size--11
This is part of a collection of math clip art images that show different statistical graphs and concepts, along with some probability concepts. |
Data Gathering |
|
Math Clip Art--Statistics and Probability-- Inferences and Sample Size--12 | Math Clip Art--Statistics and Probability-- Inferences and Sample Size--12
This is part of a collection of math clip art images that show different statistical graphs and concepts, along with some probability concepts. |
Data Gathering |
|
Math Clip Art--Statistics and Probability-- Inferences and Sample Size--9 | Math Clip Art--Statistics and Probability-- Inferences and Sample Size--9
This is part of a collection of math clip art images that show different statistical graphs and concepts, along with some probability concepts. |
Data Gathering |
|
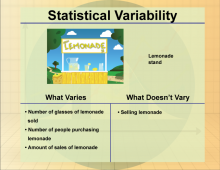
Math Clip Art--Statistics and Probability-- Statistical Variability--10 | Math Clip Art--Statistics and Probability-- Statistical Variability--10
This is part of a collection of math clip art images that show different statistical graphs and concepts, along with some probability concepts. |
Data Gathering |
|
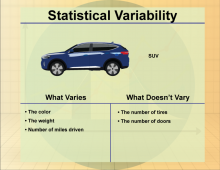
Math Clip Art--Statistics and Probability-- Statistical Variability--5 | Math Clip Art--Statistics and Probability-- Statistical Variability--5
This is part of a collection of math clip art images that show different statistical graphs and concepts, along with some probability concepts. |
Data Gathering |
|
Math Clip Art--Statistics and Probability-- Statistical Variability--6 | Math Clip Art--Statistics and Probability-- Statistical Variability--6
This is part of a collection of math clip art images that show different statistical graphs and concepts, along with some probability concepts. |
Data Gathering |
|
Math Clip Art--Statistics and Probability-- Statistical Variability--7 | Math Clip Art--Statistics and Probability-- Statistical Variability--7
This is part of a collection of math clip art images that show different statistical graphs and concepts, along with some probability concepts. |
Data Gathering |
|
Math Clip Art--Statistics and Probability-- Statistical Variability--8 | Math Clip Art--Statistics and Probability-- Statistical Variability--8
This is part of a collection of math clip art images that show different statistical graphs and concepts, along with some probability concepts. |
Data Gathering |
|
Math Clip Art--Statistics and Probability-- Statistical Variability--9 | Math Clip Art--Statistics and Probability-- Statistical Variability--9
This is part of a collection of math clip art images that show different statistical graphs and concepts, along with some probability concepts. |
Data Gathering |
|
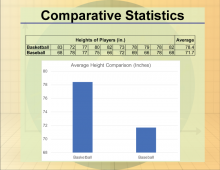
Math Clip Art--Statistics--Comparative Statistic--02 | Math Clip Art--Statistics--Comparative Statistic--02
This is part of a collection of math clip art images that show different statistical graphs and concepts, along with some probability concepts. |
Data Analysis |
|
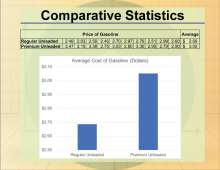
Math Clip Art--Statistics--Comparative Statistics--01 | Math Clip Art--Statistics--Comparative Statistics--01
This is part of a collection of math clip art images that show different statistical graphs and concepts, along with some probability concepts. |
Data Analysis |
|
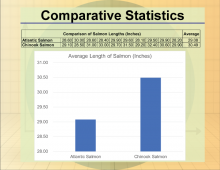
Math Clip Art--Statistics--Comparative Statistics--03 | Math Clip Art--Statistics--Comparative Statistics--03
This is part of a collection of math clip art images that show different statistical graphs and concepts, along with some probability concepts. |
Data Analysis |
|
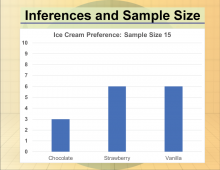
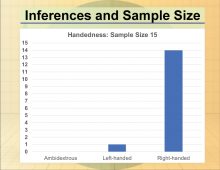
Math Clip Art--Statistics--Inferences and Sample Size--01 | Math Clip Art--Statistics--Inferences and Sample Size--01
This is part of a collection of math clip art images that show different statistical graphs and concepts, along with some probability concepts. |
Data Gathering |
|
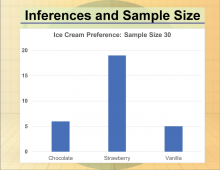
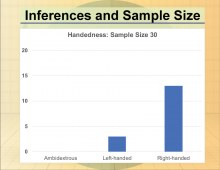
Math Clip Art--Statistics--Inferences and Sample Size--02 | Math Clip Art--Statistics--Inferences and Sample Size--02
This is part of a collection of math clip art images that show different statistical graphs and concepts, along with some probability concepts. |
Data Gathering |
|
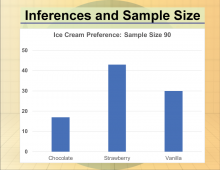
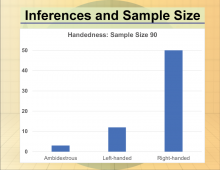
Math Clip Art--Statistics--Inferences and Sample Size--03 | Math Clip Art--Statistics--Inferences and Sample Size--03
This is part of a collection of math clip art images that show different statistical graphs and concepts, along with some probability concepts. |
Data Gathering |
|
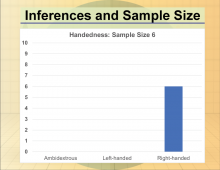
Math Clip Art--Statistics--Inferences and Sample Size--04 | Math Clip Art--Statistics--Inferences and Sample Size--04
This is part of a collection of math clip art images that show different statistical graphs and concepts, along with some probability concepts. |
Data Gathering |
|
Math Clip Art--Statistics--Inferences and Sample Size--05 | Math Clip Art--Statistics--Inferences and Sample Size--05
This is part of a collection of math clip art images that show different statistical graphs and concepts, along with some probability concepts. |
Data Gathering |
|
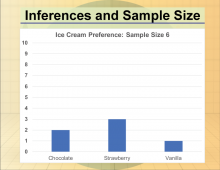
Math Clip Art--Statistics--Inferences and Sample Size--06 | Math Clip Art--Statistics--Inferences and Sample Size--06
This is part of a collection of math clip art images that show different statistical graphs and concepts, along with some probability concepts. |
Data Gathering |
|
Math Clip Art--Statistics--Inferences and Sample Size--07 | Math Clip Art--Statistics--Inferences and Sample Size--07
This is part of a collection of math clip art images that show different statistical graphs and concepts, along with some probability concepts. |
Data Gathering |
|
Math Clip Art--Statistics--Inferences and Sample Size--08 | Math Clip Art--Statistics--Inferences and Sample Size--08
This is part of a collection of math clip art images that show different statistical graphs and concepts, along with some probability concepts. |
Data Gathering |
|
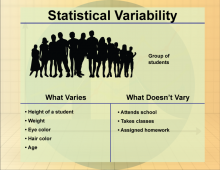
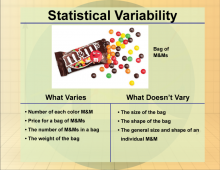
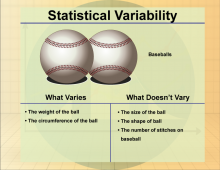
Math Clip Art--Statistics--Statistical Variability--01 | Math Clip Art--Statistics--Statistical Variability--01
This is part of a collection of math clip art images that show different statistical graphs and concepts, along with some probability concepts. |
Data Gathering |
|
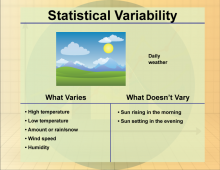
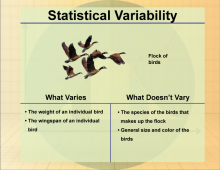
Math Clip Art--Statistics--Statistical Variability--02 | Math Clip Art--Statistics--Statistical Variability--02
This is part of a collection of math clip art images that show different statistical graphs and concepts, along with some probability concepts. |
Data Gathering |
|
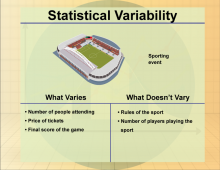
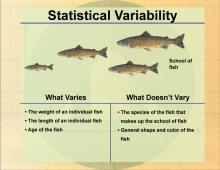
Math Clip Art--Statistics--Statistical Variability--03 | Math Clip Art--Statistics--Statistical Variability--03
This is part of a collection of math clip art images that show different statistical graphs and concepts, along with some probability concepts. |
Data Gathering |
|
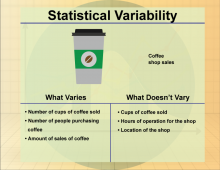
Math Clip Art--Statistics--Statistical Variability--04 | Math Clip Art--Statistics--Statistical Variability--04
This is part of a collection of math clip art images that show different statistical graphs and concepts, along with some probability concepts. |
Data Gathering |

|
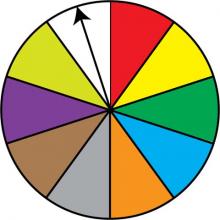
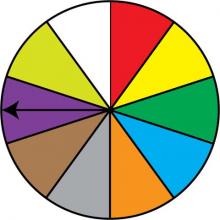
Math Clip Art: Spinner, 10 Sections--Result 1 | Math Clip Art: Spinner, 10 Sections--Result 1TopicProbability and Statistics DescriptionThis image depicts a spinner divided into ten equal sections, which are colored red, yellow, green, light blue, orange, grey, brown, purple, yellow-green, and white. The spinner's arrow points to the red section, demonstrating one of the possible outcomes. In the context of Probability and Statistics, this spinner represents a probability experiment with ten equally likely outcomes. It visually demonstrates the concepts of sample space and individual events within that space, each with a 1/10 probability of occurrence. |
Probability |
|
Math Clip Art: Spinner, 10 Sections--Result 10 | Math Clip Art: Spinner, 10 Sections--Result 10TopicProbability and Statistics DescriptionThis image depicts a spinner divided into ten equal sections, which are colored red, yellow, green, light blue, orange, grey, brown, purple, yellow-green, and white. The spinner's arrow points to the white section, demonstrating the final possible outcome in this probability model. In the field of Probability and Statistics, this spinner exemplifies a uniform probability distribution with ten equally likely outcomes. Each spin has a 1/10 probability of landing on any given color, illustrating the concept of equiprobable events in a complex scenario. |
Probability |
|
Math Clip Art: Spinner, 10 Sections--Result 2 | Math Clip Art: Spinner, 10 Sections--Result 2TopicProbability and Statistics DescriptionThis image depicts a spinner divided into ten equal sections, which are colored red, yellow, green, light blue, orange, grey, brown, purple, yellow-green, and white. The spinner's arrow points to the yellow section, demonstrating one of the possible outcomes. In the context of Probability and Statistics, this spinner represents a probability experiment with ten equally likely outcomes. It visually demonstrates the concepts of sample space and individual events within that space, each with a 1/10 probability of occurrence. |
Probability |

|
Math Clip Art: Spinner, 10 Sections--Result 3 | Math Clip Art: Spinner, 10 Sections--Result 3TopicProbability and Statistics DescriptionThis image depicts a spinner divided into ten equal sections, which are colored red, yellow, green, light blue, orange, grey, brown, purple, yellow-green, and white. The spinner's arrow points to the green section, demonstrating one of the possible outcomes. In the context of Probability and Statistics, this spinner represents a probability experiment with ten equally likely outcomes. It visually demonstrates the concepts of sample space and individual events within that space, each with a 1/10 probability of occurrence. |
Probability |

|
Math Clip Art: Spinner, 10 Sections--Result 4 | Math Clip Art: Spinner, 10 Sections--Result 4TopicProbability and Statistics DescriptionThis image depicts a spinner divided into ten equal sections, which are colored red, yellow, green, light blue, orange, grey, brown, purple, yellow-green, and white. The spinner's arrow points to the light blue section, demonstrating one of the possible outcomes. In the context of Probability and Statistics, this spinner represents a probability experiment with ten equally likely outcomes. It visually demonstrates the concepts of sample space and individual events within that space, each with a 1/10 probability of occurrence. |
Probability |
|
Math Clip Art: Spinner, 10 Sections--Result 5 | Math Clip Art: Spinner, 10 Sections--Result 5TopicProbability and Statistics DescriptionThis image depicts a spinner divided into ten equal sections, which are colored red, yellow, green, light blue, orange, grey, brown, purple, yellow-green, and white. The spinner's arrow points to the orange section, demonstrating one of the possible outcomes. In the context of Probability and Statistics, this spinner represents a probability experiment with ten equally likely outcomes. It visually demonstrates the concepts of sample space and individual events within that space, each with a 1/10 probability of occurrence. |
Probability |
|
Math Clip Art: Spinner, 10 Sections--Result 6 | Math Clip Art: Spinner, 10 Sections--Result 6TopicProbability and Statistics DescriptionThis image depicts a spinner divided into ten equal sections, which are colored red, yellow, green, light blue, orange, grey, brown, purple, yellow-green, and white. The spinner's arrow points to the grey section, demonstrating one of the possible outcomes. In the context of Probability and Statistics, this spinner represents a probability experiment with ten equally likely outcomes. It visually demonstrates the concepts of sample space and individual events within that space, each with a 1/10 probability of occurrence. |
Probability |
|
Math Clip Art: Spinner, 10 Sections--Result 7 | Math Clip Art: Spinner, 10 Sections--Result 7TopicProbability and Statistics DescriptionThis image depicts a spinner divided into ten equal sections, which are colored red, yellow, green, light blue, orange, grey, brown, purple, yellow-green, and white. The spinner's arrow points to the brown section, demonstrating one of the possible outcomes. In the context of Probability and Statistics, this spinner represents a probability experiment with ten equally likely outcomes. It visually demonstrates the concepts of sample space and individual events within that space, each with a 1/10 probability of occurrence. |
Probability |
|
Math Clip Art: Spinner, 10 Sections--Result 8 | Math Clip Art: Spinner, 10 Sections--Result 8TopicProbability and Statistics DescriptionThis image depicts a spinner divided into ten equal sections, which are colored red, yellow, green, light blue, orange, grey, brown, purple, yellow-green, and white. The spinner's arrow points to the purple section, demonstrating one of the possible outcomes. In the context of Probability and Statistics, this spinner represents a probability experiment with ten equally likely outcomes. It visually demonstrates the concepts of sample space and individual events within that space, each with a 1/10 probability of occurrence. |
Probability |

|
Math Clip Art: Spinner, 10 Sections--Result 9 | Math Clip Art: Spinner, 10 Sections--Result 9TopicProbability and Statistics DescriptionThis image depicts a spinner divided into ten equal sections, which are colored red, yellow, green, light blue, orange, grey, brown, purple, yellow-green, and white. The spinner's arrow points to the yellow-green section, demonstrating one of the possible outcomes. In the context of Probability and Statistics, this spinner represents a probability experiment with ten equally likely outcomes. It visually demonstrates the concepts of sample space and individual events within that space, each with a 1/10 probability of occurrence. |
Probability |
|
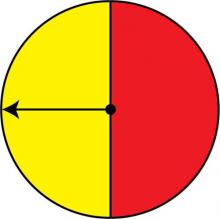
Math Clip Art: Spinner, 2 Sections--Result 1 | Math Clip Art: Spinner, 2 Sections--Result 1TopicProbability and Statistics DescriptionThis image depicts a basic spinner divided into two equal sections, colored red and yellow. The spinner's arrow points to the yellow section, indicating a specific result. This spinner relates to Probability and Statistics by visually representing a simple probability model. With two equal sections, each outcome has a 50% chance of occurring, demonstrating the concept of equally likely events. |
Probability |
|
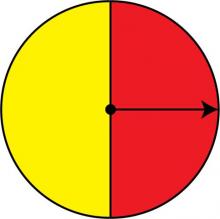
Math Clip Art: Spinner, 2 Sections--Result 2 | Math Clip Art: Spinner, 2 Sections--Result 2TopicProbability and Statistics DescriptionThis image shows a spinner divided into two equal sections, colored red and yellow. The spinner's arrow points to the red section, illustrating a different outcome from the previous image. In the context of Probability and Statistics, this spinner represents a simple probability experiment with two equally likely outcomes. It visually demonstrates the concept of sample space and individual events within that space. |
Probability |
|
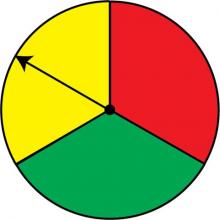
Math Clip Art: Spinner, 3 Sections--Result 1 | Math Clip Art: Spinner, 3 Sections--Result 1TopicProbability and Statistics DescriptionThis image presents a spinner divided into three equal sections colored red, green, and yellow. The spinner's arrow points to the yellow section, illustrating one possible outcome. In the realm of Probability and Statistics, this spinner introduces a more complex probability model compared to simpler two-section designs. It exemplifies the concept of equally likely events in a scenario with three possible outcomes, each with a probability of 1/3. |
Probability |