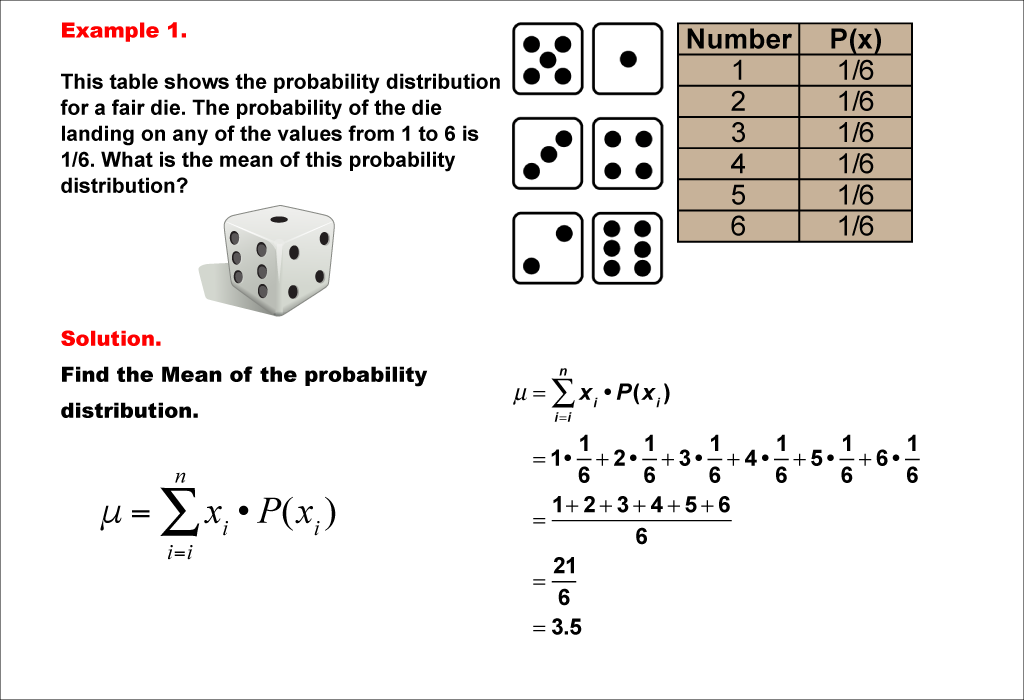
Math Examples Collection: Mean of a Probability Distribution
 | OverviewThis collection of math examples focuses on Measures of Central Tendency, specifically the Mean of a Probability Distribution. The set comprises 7 images that progressively increase in complexity, covering various skills related to calculating and understanding the mean in probability distributions. These examples utilize visual models to simplify complex concepts, making them more accessible to students. By providing multiple examples, the collection allows students to analyze different scenarios, reinforcing their understanding of the topic. Media4Math offers a more comprehensive set of examples compared to typical textbooks and digital curricula, ensuring a thorough grasp of the subject matter. The collection covers essential skills such as identifying probability distributions, calculating expected values, and interpreting results in real-world contexts. Students will benefit from the step-by-step approach and the variety of problem types presented. Subscribers to Media4Math can take advantage of the Slide Show Creator tool at https://www.media4math.com/SlideShowCreator to create customized presentations using these resources. This feature allows educators to tailor their lessons to their students' specific needs, incorporating these valuable examples into their teaching materials. |


