
Illustrative Math Alignment: Grade 7 Unit 9
Putting it All Together
Lesson 9: Measurement Error (Part 2)
Use the following Media4Math resources with this Illustrative Math lesson.
| Thumbnail Image | Title | Body | Curriculum Topic |
|---|---|---|---|
|
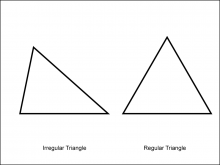
Math Clip Art--Geometry Concepts--Polygons--Triangle | Math Clip Art--Polygons--TriangleTopicGeometry Concepts DescriptionThis image shows two triangles: one regular and one irregular. A triangle is a three-sided polygon. In a regular triangle, also known as an equilateral triangle, all sides and angles are equal, with each interior angle measuring 60 degrees. This regularity gives it a symmetrical and balanced appearance. An irregular triangle, however, has sides and angles that are not all equal. This asymmetry allows the triangle to take on various shapes, depending on the specific lengths and angles of its sides. |
Definition of a Polygon |
|
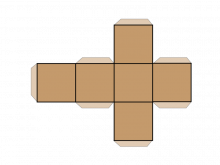
Math Clip Art--Net for a Cube | Math Clip Art--Net for a CubeTopicGeometry DescriptionThis math clip art image is part of a series showcasing 2D nets of 3D figures, specifically focusing on the net for a cube. The image displays a flattened representation of a cube, consisting of six connected squares arranged in a cross-like pattern. This visual aid is crucial for students to understand the relationship between 2D shapes and their 3D counterparts. |
3-Dimensional Figures |
|
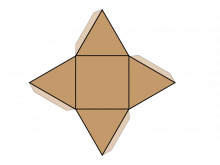
Math Clip Art--Net for a Pyramid | Math Clip Art--Net for a PyramidTopicGeometry DescriptionThis math clip art image is part of a series illustrating 2D nets of 3D figures, with this particular image focusing on the net for a pyramid. The image shows a flattened representation of a square-based pyramid, consisting of a square base surrounded by four triangular faces. This visual aid is essential for students to comprehend how a 3D pyramid can be unfolded into a 2D pattern. |
3-Dimensional Figures |
|
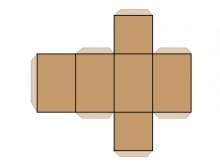
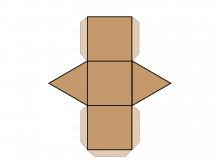
Math Clip Art--Net for a Rectangular Prism | Math Clip Art--Net for a Rectangular PrismTopicGeometry DescriptionThis math clip art image is part of a series showcasing 2D nets of 3D figures, specifically illustrating the net for a rectangular prism. The image displays a flattened representation of a rectangular prism, consisting of six connected rectangles arranged in a cross-like pattern. This visual aid is crucial for students to understand how a 3D rectangular prism can be unfolded into a 2D shape. |
3-Dimensional Figures |
|
Math Clip Art--Net for a Triangular Prism | Math Clip Art--Net for a Triangular PrismTopicGeometry DescriptionThis math clip art image is part of a series illustrating 2D nets of 3D figures, with this particular image focusing on the net for a triangular prism. The image shows a flattened representation of a triangular prism, consisting of two triangular bases and three rectangular faces. This visual aid is essential for students to comprehend how a 3D triangular prism can be unfolded into a 2D pattern. |
3-Dimensional Figures |
|
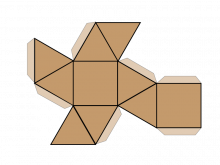
Math Clip Art--Net for an Antiprism | Math Clip Art--Net for an AntiprismTopicGeometry DescriptionThis math clip art image is part of a series showcasing 2D nets of 3D figures, specifically illustrating the net for an antiprism. The image displays a flattened representation of an antiprism, consisting of two polygonal bases (typically regular polygons) connected by a band of triangles. This visual aid is crucial for students to understand how a 3D antiprism can be unfolded into a 2D shape. |
3-Dimensional Figures |
|
Math Clip Art--Percent Visualizations 1 | Math Clip Art--Percent Visualizations 1 This is a collection of clip art images that show visual models for percents. |
Ratios and Rates and Percents |
|
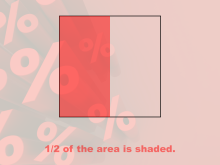
Math Clip Art--Percent Visualizations 2 | Math Clip Art--Percent Visualizations 2 This is a collection of clip art images that show visual models for percents. |
Ratios and Rates and Percents |
|
Math Clip Art--Percent Visualizations 3 | Math Clip Art--Percent Visualizations 3 This is a collection of clip art images that show visual models for percents. |
Ratios and Rates and Percents |

|
Math Clip Art--Percent Visualizations 4 | Math Clip Art--Percent Visualizations 4 This is a collection of clip art images that show visual models for percents. |
Ratios and Rates and Percents |

|
Math Clip Art--Percent Visualizations 5 | Math Clip Art--Percent Visualizations 5 This is a collection of clip art images that show visual models for percents. |
Ratios and Rates and Percents |
|
Math Clip Art--Percent Visualizations 6 | Math Clip Art--Percent Visualizations 6 This is a collection of clip art images that show visual models for percents. |
Ratios and Rates and Percents |
|
Math Clip Art--Percent Visualizations 7 | Math Clip Art--Percent Visualizations 7 This is a collection of clip art images that show visual models for percents. |
Ratios and Rates and Percents |
|
Math Clip Art--Percent Visualizations 8 | Math Clip Art--Percent Visualizations 8 This is a collection of clip art images that show visual models for percents. |
Ratios and Rates and Percents |
|
Math Clip Art--Percent Visualizations 9 | Math Clip Art--Percent Visualizations 9 This is a collection of clip art images that show visual models for percents. |
Ratios and Rates and Percents |
|
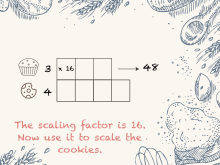
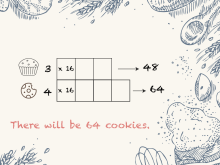
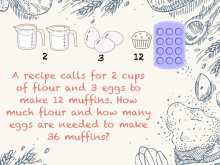
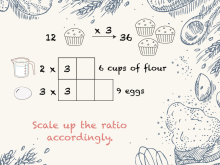
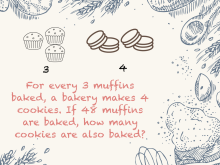
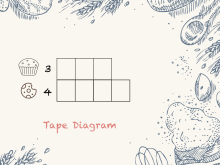
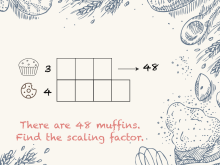
Math Clip Art--Rates and Tape Diagrams: Cooking 1 | Math Clip Art--Rates and Tape Diagrams: Cooking 1 This is a collection of clip art images that show how to use tape diagrams to solve ratio and rate problems. |
Ratios and Rates |
|
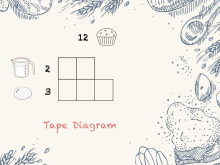
Math Clip Art--Rates and Tape Diagrams: Cooking 10 | Math Clip Art--Rates and Tape Diagrams: Cooking 10 This is a collection of clip art images that show how to use tape diagrams to solve ratio and rate problems. |
Ratios and Rates |
|
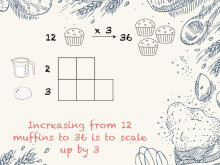
Math Clip Art--Rates and Tape Diagrams: Cooking 11 | Math Clip Art--Rates and Tape Diagrams: Cooking 11 This is a collection of clip art images that show how to use tape diagrams to solve ratio and rate problems. |
Ratios and Rates |
|
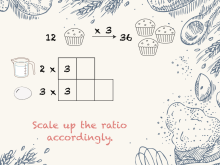
Math Clip Art--Rates and Tape Diagrams: Cooking 2 | Math Clip Art--Rates and Tape Diagrams: Cooking 2 This is a collection of clip art images that show how to use tape diagrams to solve ratio and rate problems. |
Ratios and Rates |
|
Math Clip Art--Rates and Tape Diagrams: Cooking 3 | Math Clip Art--Rates and Tape Diagrams: Cooking 3 This is a collection of clip art images that show how to use tape diagrams to solve ratio and rate problems. |
Ratios and Rates |
|
Math Clip Art--Rates and Tape Diagrams: Cooking 4 | Math Clip Art--Rates and Tape Diagrams: Cooking 4 This is a collection of clip art images that show how to use tape diagrams to solve ratio and rate problems. |
Ratios and Rates |
|
Math Clip Art--Rates and Tape Diagrams: Cooking 5 | Math Clip Art--Rates and Tape Diagrams: Cooking 5 This is a collection of clip art images that show how to use tape diagrams to solve ratio and rate problems. |
Ratios and Rates |
|
Math Clip Art--Rates and Tape Diagrams: Cooking 6 | Math Clip Art--Rates and Tape Diagrams: Cooking 6 This is a collection of clip art images that show how to use tape diagrams to solve ratio and rate problems. |
Ratios and Rates |
|
Math Clip Art--Rates and Tape Diagrams: Cooking 7 | Math Clip Art--Rates and Tape Diagrams: Cooking 7 This is a collection of clip art images that show how to use tape diagrams to solve ratio and rate problems. |
Ratios and Rates |
|
Math Clip Art--Rates and Tape Diagrams: Cooking 8 | Math Clip Art--Rates and Tape Diagrams: Cooking 8 This is a collection of clip art images that show how to use tape diagrams to solve ratio and rate problems. |
Ratios and Rates |
|
Math Clip Art--Rates and Tape Diagrams: Cooking 9 | Math Clip Art--Rates and Tape Diagrams: Cooking 9 This is a collection of clip art images that show how to use tape diagrams to solve ratio and rate problems. |
Ratios and Rates |
|
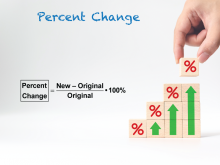
Math Clip Art--Ratios, Proportions, Percents--Percent Change 01 | Math Clip Art--Ratios, Proportions, Percents--Percent Change 01TopicRatios, Proportions, and Percents DescriptionThe image introduces the concept of percent change with the formula: Percent Change = (New - Original) / Original * 100%. It establishes the formula as the foundation for understanding percent change throughout the sequence. Math clip art provides a visual and engaging way to explore complex mathematical concepts such as percent change. These examples illustrate how numbers, fractions, and percentages are interconnected, helping to build students' numerical reasoning skills. |
Percents |
|
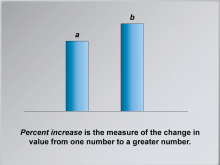
Math Clip Art--Ratios, Proportions, Percents--Percent Change 02 | Math Clip Art--Ratios, Proportions, Percents--Percent Change 02TopicRatios, Proportions, and Percents DescriptionThis image explains that percent increase measures the change from one number to a greater number. It provides context for when to apply the concept of percent increase in real-life scenarios. Math clip art provides a visual and engaging way to explore complex mathematical concepts such as percent change. These examples illustrate how numbers, fractions, and percentages are interconnected, helping to build students' numerical reasoning skills. |
Percents |
|
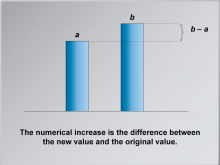
Math Clip Art--Ratios, Proportions, Percents--Percent Change 03 | Math Clip Art--Ratios, Proportions, Percents--Percent Change 03TopicRatios, Proportions, and Percents DescriptionThis image highlights that the numerical increase is the difference between the new and original values. It adds clarity by breaking down the calculation into a numerical difference. Math clip art provides a visual and engaging way to explore complex mathematical concepts such as percent change. These examples illustrate how numbers, fractions, and percentages are interconnected, helping to build students' numerical reasoning skills. |
Percents |
|
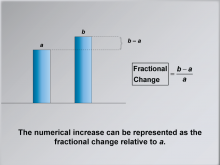
Math Clip Art--Ratios, Proportions, Percents--Percent Change 04 | Math Clip Art--Ratios, Proportions, Percents--Percent Change 04TopicRatios, Proportions, and Percents DescriptionThis image demonstrates how numerical increase is represented as fractional change using the formula: (b - a) / a. It bridges numerical increase to fractional change, setting up for conversion to percent increase. Math clip art provides a visual and engaging way to explore complex mathematical concepts such as percent change. These examples illustrate how numbers, fractions, and percentages are interconnected, helping to build students' numerical reasoning skills. |
Percents |
|
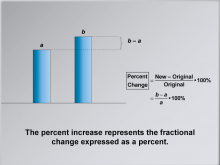
Math Clip Art--Ratios, Proportions, Percents--Percent Change 05 | Math Clip Art--Ratios, Proportions, Percents--Percent Change 05TopicRatios, Proportions, and Percents DescriptionThis image shows the formula for percent change as a fractional change expressed as a percentage: (b - a) / a * 100%. It reinforces the connection between fractional change and percent increase as part of the calculation process. Math clip art provides a visual and engaging way to explore complex mathematical concepts such as percent change. These examples illustrate how numbers, fractions, and percentages are interconnected, helping to build students' numerical reasoning skills. |
Percents |
|
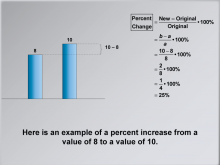
Math Clip Art--Ratios, Proportions, Percents--Percent Change 06 | Math Clip Art--Ratios, Proportions, Percents--Percent Change 06TopicRatios, Proportions, and Percents DescriptionThis image provides an example of a percent increase calculation from 8 to 10, resulting in 25%. It offers a practical example to illustrate how the formula is applied to real numbers. Math clip art provides a visual and engaging way to explore complex mathematical concepts such as percent change. These examples illustrate how numbers, fractions, and percentages are interconnected, helping to build students' numerical reasoning skills. |
Percents |
|
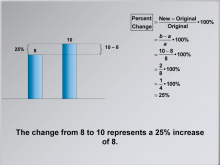
Math Clip Art--Ratios, Proportions, Percents--Percent Change 07 | Math Clip Art--Ratios, Proportions, Percents--Percent Change 07TopicRatios, Proportions, and Percents DescriptionThis image reiterates the example calculation, emphasizing that the change from 8 to 10 is a 25% increase. It reinforces understanding by repeating the example with emphasis on the interpretation of the result. Math clip art provides a visual and engaging way to explore complex mathematical concepts such as percent change. These examples illustrate how numbers, fractions, and percentages are interconnected, helping to build students' numerical reasoning skills. |
Percents |
|
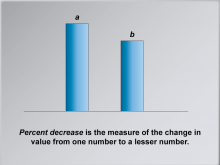
Math Clip Art--Ratios, Proportions, Percents--Percent Change 08 | Math Clip Art--Ratios, Proportions, Percents--Percent Change 08TopicRatios, Proportions, and Percents DescriptionThis image defines percent decrease as the change from one number to a lesser number. It introduces the complementary concept of percent decrease to show both directions of percent change. Math clip art provides a visual and engaging way to explore complex mathematical concepts such as percent change. These examples illustrate how numbers, fractions, and percentages are interconnected, helping to build students' numerical reasoning skills. |
Percents |
|
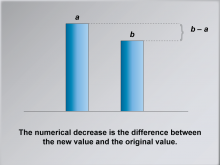
Math Clip Art--Ratios, Proportions, Percents--Percent Change 09 | Math Clip Art--Ratios, Proportions, Percents--Percent Change 09TopicRatios, Proportions, and Percents DescriptionThis image explains that numerical decrease is the difference between the new and original values. It mirrors the earlier explanation of numerical increase, ensuring consistency in presenting both cases. Math clip art provides a visual and engaging way to explore complex mathematical concepts such as percent change. These examples illustrate how numbers, fractions, and percentages are interconnected, helping to build students' numerical reasoning skills. |
Percents |
|
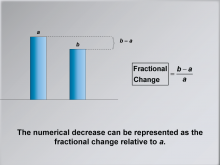
Math Clip Art--Ratios, Proportions, Percents--Percent Change 10 | Math Clip Art--Ratios, Proportions, Percents--Percent Change 10TopicRatios, Proportions, and Percents DescriptionThis image demonstrates fractional change for a decrease using the formula: (b - a) / a. It completes the explanation of percent change by connecting numerical decrease to fractional representation. Math clip art provides a visual and engaging way to explore complex mathematical concepts such as percent change. These examples illustrate how numbers, fractions, and percentages are interconnected, helping to build students' numerical reasoning skills. |
Percents |
|
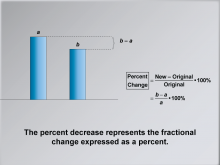
Math Clip Art--Ratios, Proportions, Percents--Percent Change 11 | Math Clip Art--Ratios, Proportions, Percents--Percent Change 11TopicRatios, Proportions, and Percents DescriptionThis image explains that percent decrease represents fractional change expressed as a percentage: (b - a) / a * 100%. It extends the explanation to show how fractional change can be converted to percent decrease. Math clip art provides a visual and engaging way to explore complex mathematical concepts such as percent change. These examples illustrate how numbers, fractions, and percentages are interconnected, helping to build students' numerical reasoning skills. |
Percents |
|
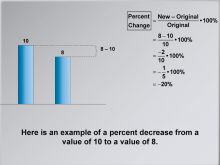
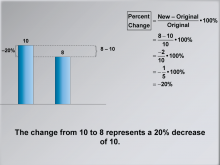
Math Clip Art--Ratios, Proportions, Percents--Percent Change 12 | Math Clip Art--Ratios, Proportions, Percents--Percent Change 12TopicRatios, Proportions, and Percents DescriptionThis image provides an example of a percent decrease calculation from 10 to 8, resulting in -20%. It offers a practical example illustrating the application of the formula to calculate percent decrease. Math clip art provides a visual and engaging way to explore complex mathematical concepts such as percent change. These examples illustrate how numbers, fractions, and percentages are interconnected, helping to build students' numerical reasoning skills. |
Percents |
|
Math Clip Art--Ratios, Proportions, Percents--Percent Change 13 | Math Clip Art--Ratios, Proportions, Percents--Percent Change 13TopicRatios, Proportions, and Percents DescriptionThis image reiterates the example, emphasizing that the change from 10 to 8 represents a 20% decrease. It reinforces understanding by summarizing the example with focus on the final interpretation of the result. Math clip art provides a visual and engaging way to explore complex mathematical concepts such as percent change. These examples illustrate how numbers, fractions, and percentages are interconnected, helping to build students' numerical reasoning skills. |
Percents |
|
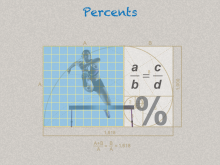
Math Clip Art--Ratios, Proportions, Percents--Percents 01 | Math Clip Art--Ratios, Proportions, Percents--Percents 01TopicRatios, Proportions, and Percents DescriptionThe image illustrates the concept of an introductory image that visually connects percents with proportions, showcasing a grid and a formula (a / b = c / d) next to a hurdler and a large percent sign. The golden ratio a / b = 1.618 is also present, symbolizing relationships, and expands on this idea by showing that serves as a thematic and conceptual introduction to percents by emphasizing proportional relationships and the idea of ratios. |
Percents |
|
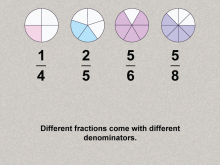
Math Clip Art--Ratios, Proportions, Percents--Percents 02 | Math Clip Art--Ratios, Proportions, Percents--Percents 02TopicRatios, Proportions, and Percents DescriptionThe image illustrates the concept of fractions with different denominators: 1/4, 2/5, 5/6, and 5/8, each depicted as shaded portions of circles. and expands on this idea by showing that highlights the challenge of comparing fractions with different denominators, setting up the need for a common framework such as percents. |
Percents |
|
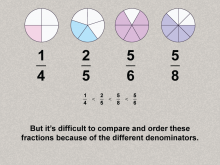
Math Clip Art--Ratios, Proportions, Percents--Percents 03 | Math Clip Art--Ratios, Proportions, Percents--Percents 03TopicRatios, Proportions, and Percents DescriptionThe image illustrates the concept of and expands on the previous image by comparing and ordering the fractions using inequality symbols: 1/4 < 2/5 < 5/8 < 5/6. This image expands on this idea by emphasizing the difficulty of comparing fractions and transitions to the rationale for using percents as a standard for comparison. |
Percents |
|
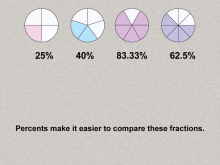
Math Clip Art--Ratios, Proportions, Percents--Percents 04 | Math Clip Art--Ratios, Proportions, Percents--Percents 04TopicRatios, Proportions, and Percents DescriptionThe image illustrates the concept of converting the fractions 1/4, 2/5, 5/6, and 5/8 into percents (25%, 40%, 83.33%, 62.5%) with their corresponding pie diagrams. It expands on this idea by showing that introduces percents as an easier method for comparing fractions by representing them with a common denominator of 100. |
Percents |
|
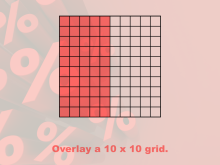
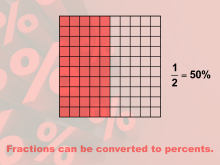
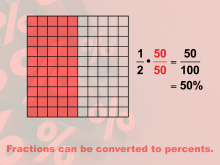
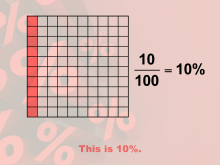
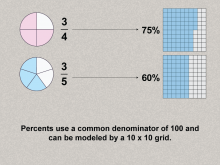
Math Clip Art--Ratios, Proportions, Percents--Percents 05 | Math Clip Art--Ratios, Proportions, Percents--Percents 05TopicRatios, Proportions, and Percents DescriptionThe image illustrates the concept of how fractions such as 3/4 and 3/5 convert to percents (75% and 60%) using shaded 10 x 10 grids. It expands on this idea by showing the concept of percents using a visual and tangible representation, reinforcing the idea of 100 as the base for comparison. |
Percents |
|
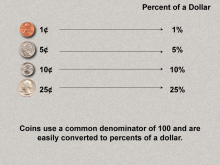
Math Clip Art--Ratios, Proportions, Percents--Percents 06 | Math Clip Art--Ratios, Proportions, Percents--Percents 06TopicRatios, Proportions, and Percents DescriptionThe image illustrates the concept of connecting coins (1¢, 5¢, 10¢, 25¢) to their percent values of a dollar (1%, 5%, 10%, 25%). It expands on this idea by establishing a real-world application of percents, showing their utility in everyday contexts like money. The topic of Ratios, Proportions, and Percents explores fundamental math concepts by using practical examples. This collection aids in visualizing the connection between different mathematical forms such as ratios, percents, and fractions, making abstract concepts more accessible to students. |
Percents |
|
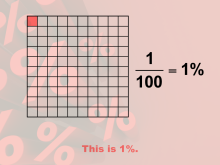
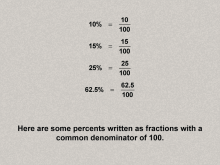
Math Clip Art--Ratios, Proportions, Percents--Percents 07 | Math Clip Art--Ratios, Proportions, Percents--Percents 07TopicRatios, Proportions, and Percents DescriptionThe image illustrates percentages as fractions with a denominator of 100, such as 10% = 10 / 100, 15% = 15 / 100, and so on. It expands on this idea by showing how percents relate to fractions, reinforcing their equivalency and further grounding the concept. The topic of Ratios, Proportions, and Percents explores fundamental math concepts by using practical examples. This collection aids in visualizing the connection between different mathematical forms such as ratios, percents, and fractions, making abstract concepts more accessible to students. |
Percents |
|
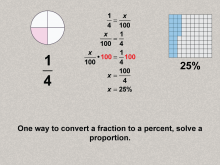
Math Clip Art--Ratios, Proportions, Percents--Percents 08 | Math Clip Art--Ratios, Proportions, Percents--Percents 08TopicRatios, Proportions, and Percents DescriptionThe image illustrates how to convert 1/4 to a percent using the proportion method: (1 / 4 = x / 100), solving for x = 25%. and expands on this idea by showing that provides a step-by-step method to convert fractions to percents, introducing proportional reasoning. The topic of Ratios, Proportions, and Percents explores fundamental math concepts by using practical examples. This collection aids in visualizing the connection between different mathematical forms such as ratios, percents, and fractions, making abstract concepts more accessible to students. |
Percents |
|
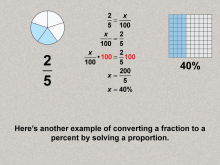
Math Clip Art--Ratios, Proportions, Percents--Percents 09 | Math Clip Art--Ratios, Proportions, Percents--Percents 09TopicRatios, Proportions, and Percents DescriptionThe image illustrates the concept of converting a fraction to a percent using proportions, with 2/5 converting to 40%. and expands on this idea by showing that reinforces the proportion method with another example, building understanding through repetition. The topic of Ratios, Proportions, and Percents explores fundamental math concepts by using practical examples. This collection aids in visualizing the connection between different mathematical forms such as ratios, percents, and fractions, making abstract concepts more accessible to students. |
Percents |
|
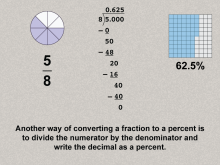
Math Clip Art--Ratios, Proportions, Percents--Percents 10 | Math Clip Art--Ratios, Proportions, Percents--Percents 10TopicRatios, Proportions, and Percents DescriptionThe image illustrates the concept of converting fractions to percents, dividing 5 by 8 to get 62.5% and expands on this idea by showing an alternative method for conversion, allowing for flexibility in approaches. The topic of Ratios, Proportions, and Percents explores fundamental math concepts by using practical examples. This collection aids in visualizing the connection between different mathematical forms such as ratios, percents, and fractions, making abstract concepts more accessible to students. |
Percents |
|
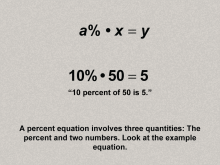
Math Clip Art--Ratios, Proportions, Percents--Percents 11 | Math Clip Art--Ratios, Proportions, Percents--Percents 11TopicRatios, Proportions, and Percents DescriptionThe image illustrates the concept of the general equation for percents: a% * x = y, using the example 10% * 50 = 5. It emphasizes the three components of a percent equation: the percent, a base number, and the result, and expands on this idea by showing that establishes the foundational equation for solving percent problems, serving as a gateway to explore specific types of percent equations. |
Percents |