
Illustrative Math Alignment: Grade 7 Unit 9
Putting it All Together
Lesson 9: Measurement Error (Part 2)
Use the following Media4Math resources with this Illustrative Math lesson.
| Thumbnail Image | Title | Body | Curriculum Topic |
|---|---|---|---|
|
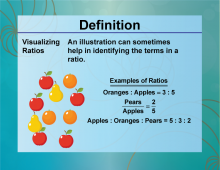
Definition--Ratios, Proportions, and Percents Concepts--Visualizing Ratios | Visualizing RatiosTopicRatios, Proportions, and Percents DefinitionVisualizing ratios involves using diagrams or models to represent and understand the relationship between two quantities. DescriptionVisualizing ratios is essential in various fields, such as mathematics, science, and economics, where understanding the relationship between quantities is crucial. For example, using a bar model or a double number line can help illustrate the ratio of 3:4. |
Ratios and Rates |
|
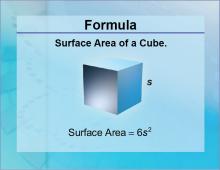
Formulas--Surface Area of a Cube | Formulas--Surface Area of a Cube
The formula for the Surface Area of a Cube. This is part of a collection of math formulas. To see the complete collection of formulas, click on this link. Note: The download is a JPG file.Related ResourcesTo see resources related to this topic click on the Related Resources tab above. |
Surface Area |
|
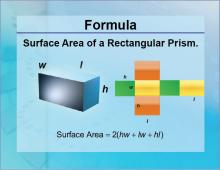
Formulas--Surface Area of a Rectangular Prism | Formulas--Surface Area of a Rectangular Prism
The formula for the Surface Area of a Rectangular Prism. This is part of a collection of math formulas. To see the complete collection of formulas, click on this link. Note: The download is a JPG file.Related ResourcesTo see resources related to this topic click on the Related Resources tab above. |
Surface Area |
|
Geometry Applications Teachers Guide: 3D Geometry | Geometry Applications Teachers Guide: 3D Geometry
This is the Teacher's Guide that accompanies Geometry Applications: 3D Geometry. This is part of a collection of teacher's guides. To see the complete collection of teacher's guides, click on this link. Note: The download is a PDF file.Related ResourcesTo see resources related to this topic click on the Related Resources tab above. |
Applications of 3D Geometry |

|
Google Earth Voyager Story: Architectural Prisms, Part 1 | Google Earth Voyager Story: Architectural Prisms, Part 1TopicGeometric Models |
Triangular Prisms |

|
Google Earth Voyager Story: Architectural Prisms, Part 2 | Google Earth Voyager Story: Architectural Prisms, Part 2TopicGeometric Models |
Rectangular Prisms |

|
Google Earth Voyager Story: Architectural Prisms, Part 3 | Google Earth Voyager Story: Architectural Prisms, Part 3
In this Google Earth Voyager story visit architectural landmarks in New York City to learn about the geometry of prisms. In this lesson, visit the Freedom Tower in Lower Manhattan and learn about antiprisms. Then build a scale model of the Freedom Tower. This is part of a collection of Google Earth Voyager Stories that use Google's mapping technology to explore relevant math stories. To see the complete collection of the Google Earth Voyager Stories, click on this link. Note: The download is the teacher's guide.Viewing Media4Math Stories on Google EarthThese Google Earth Voyager Stories are also available on Google Earth. Best viewed in Chrome, click on the links below to view these dynamic stories using Google's technology: |
3-Dimensional Figures |
|
Google Earth Voyager Story: Polygon Architecture, Part 1 | Google Earth Voyager Story: Polygon Architecture, Part 1TopicGeometric Models |
Applications of Polygons |

|
Google Earth Voyager Story: Polygon Architecture, Part 2 | Google Earth Voyager Story: Polygon Architecture, Part 2TopicGeometric Models |
Applications of Polygons |

|
Instructional Resource--Strategy Pack--Percent One Number Is of Another | Instructional Resource | Strategy Pack | The Percent One Number Is of Another Learn different strategies for finding the percent one number is of another. The Strategy Packs provide alternate ways of solving the same problem, giving your students different approaches to the same problem. The goal of the Strategy Packs is to encourage your students to think strategically when solving math problems. —PRESS PREVIEW TO LAUNCH THE PRESENTATION—To see the complete collection of Instructional Resources, click on this link.Note: The download is a PPT file. |
Percents |

|
INSTRUCTIONAL RESOURCE: Algebra Application: Cicada Cycles | INSTRUCTIONAL RESOURCE: Algebra Application: Cicada Cycles
In this Algebra Application, students study the life cycles of 13- and 17-year cicadas, as well as the populations of bird predators. Students develop a mathematical model using spreadsheets and investigate why the prime number life cycles help the cicadas. The math topics covered include: Mathematical modeling, Data gathering and analysis, Percent increase and decrease, Prime numbers and composites. This real world application of math concepts will engage your students. |
Applications of Ratios, Proportions, and Percents, Percents and Numerical Expressions |
|
INSTRUCTIONAL RESOURCE: Algebra Application: Interior Angles of a Polygon | In this Slide Show, apply concepts of linear functions to the context of the interior angles of a polygon. Note: The download is a PPT file. |
Definition of a Polygon |
|
|
INSTRUCTIONAL RESOURCE: Math Examples 37 | INSTRUCTIONAL RESOURCE: Math Examples--Polygon Classification
This set of tutorials provides 36 examples of how to classify polygons based on side and angle characteristics. This is part of a collection of math examples for a variety of math topics. To see the complete collection of these resources, click on this link. Note: The download is a PPT file.Library of Instructional ResourcesTo see the complete library of Instructional Resources , click on this link. |
Definition of a Polygon |
|
|
INSTRUCTIONAL RESOURCE: Math Examples 42 | INSTRUCTIONAL RESOURCE: Math Examples--Quadrilateral Area and Perimeter
This set of tutorials provides an overview of the 24 worked-out examples that show how to calculate the area and perimeter of different quadrilaterals. This is part of a collection of math examples for a variety of math topics. To see the complete collection of these resources, click on this link. Note: The download is a PPT file.Library of Instructional ResourcesTo see the complete library of Instructional Resources , click on this link. |
Area and Perimeter of Quadrilaterals |
|
|
INSTRUCTIONAL RESOURCE: Math Examples 55 | INSTRUCTIONAL RESOURCE: Math Examples--Surface Area
This set of tutorials provides an overview of the 24 worked-out examples that show how to calculate the surface area of different three-dimensional figures. This is part of a collection of math examples for a variety of math topics. To see the complete collection of these resources, click on this link. Note: The download is a PPT file.Library of Instructional ResourcesTo see the complete library of Instructional Resources , click on this link. |
Surface Area |
|
Instructional Resource: TI-Nspire Activity: Constructing and Measuring the Area of a Polygon | In this TI-Nspire Activity, use the Geometry Tools to construct a regular polygon and measure its area using the apothem-perimeter formula. Note: The Preview is a Google Slide Show and the download is a PPT. Subscribers to Media4Math can download resources. To see the complete collection of TI graphing calculator resources, click on this Link. |
Geometric Constructions with Polygons |

|
Lesson Plan--Ratios, Proportions, and Percents (Gr 7)--Lesson 5--Solving Multi-Step Ratio and Percent Problems | Lesson Plan: Solving Multi-Step Ratio Problems In this lesson, students will develop their problem-solving skills by tackling multi-step ratio and proportion problems. They will learn how to analyze complex ratio scenarios, apply proportional reasoning, and use unit conversions to solve real-world problems. This lesson builds on students' understanding of ratios and proportions, reinforcing their ability to work through multi-step calculations with confidence. Key concepts covered in this lesson include: |
Applications of Ratios, Proportions, and Percents |

|
Lesson Plan--Ratios, Proportions, and Percents (Gr 8)--Lesson 2--Solving Percent Problems Using Proportional Reasoning | Lesson Plan: Solving Percent Problems In this lesson, students will develop their problem-solving skills by learning multiple strategies for solving percent problems. Using proportions and equations, they will calculate percent increase, percent decrease, discounts, taxes, commissions, and simple interest. This lesson builds on proportional reasoning skills and applies them to real-world financial and mathematical situations. Key concepts covered in this lesson include: |
Percents |

|
Lesson Plan: Cross-Sections of 3D Figures, Part 2 | Lesson Plan: Cross-Sections of Rectangular Prisms, Spheres, and Pyramids In this engaging geometry lesson, students will explore how rectangular prisms, spheres, and pyramids are affected by different slicing planes. Using visual aids, real-world examples, and hands-on activities, students will identify the cross-sections created by horizontal, vertical, and diagonal cuts. Through interactive exploration, students will learn that a rectangular prism produces rectangular or parallelogram cross-sections, a sphere always results in a circular cross-section regardless of the slicing direction, and a pyramid creates triangles, trapezoids, or smaller versions of its base. The lesson also introduces the volume formula for a rectangular prism, reinforcing the connection between cross-sections and three-dimensional measurements. |
Applications of 3D Geometry |

|
Lesson Plan: Cross-Sections of 3D Figures, Part 3 | Lesson Plan: Cross-Sections of Triangular Prisms, Antiprisms, and Tetrahedrons In this engaging geometry lesson, students will explore cross-sections of triangular prisms, antiprisms, and tetrahedrons. Through hands-on activities, real-world examples, and animated visuals, students will investigate how different slicing planes impact three-dimensional figures. By analyzing horizontal, vertical, and diagonal cross-sections, students will develop a deeper understanding of geometric properties and spatial reasoning. |
Applications of 3D Geometry |

|
Lesson Plan: Nets of 3D Figures, Part 1 | Lesson Plan: Introduction to Nets and Basic 3D Shapes In this engaging and interactive lesson, students explore the connection between 2D nets and 3D geometric figures. Through animations, printable foldable nets, and hands-on activities, students will develop a deeper understanding of how nets transform into solid figures such as cubes, rectangular prisms, and triangular prisms. This lesson also reinforces key geometry concepts, including faces, edges, and vertices, while guiding students through surface area calculations using nets. |
3-Dimensional Figures |

|
Lesson Plan: Nets of 3D Figures, Part 2 | Lesson Plan: Pyramids, Tetrahedra, and Octahedra In this engaging lesson, students explore the geometry of pyramids, tetrahedra, and octahedra using 2D nets and 3D models. Through interactive animations, printable foldable nets, and hands-on activities, students develop a deeper understanding of how pyramids differ from prisms and why their triangular faces provide structural stability. This lesson covers key geometry concepts, including faces, edges, vertices, and surface area calculations. |
3-Dimensional Figures |

|
Lesson Plan: Nets of 3D Figures, Part 3 | Lesson Plan: Advanced Polyhedra and Cylindrical Shapes In this interactive lesson, students explore the geometry of cylinders and advanced polyhedra, including the dodecahedron and icosahedron. Using 2D nets and 3D models, students will construct these shapes, analyze their faces, edges, and vertices, and compare their properties to simpler geometric figures. This lesson emphasizes the differences between curved-surface shapes, like cylinders, and flat-faced polyhedra. |
3-Dimensional Figures |
|
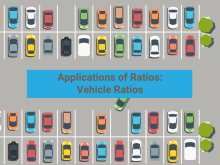
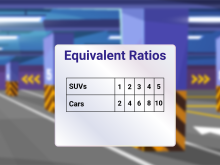
Math Clip Art--Applications of Equivalent Ratios--Vehicle Ratios 1 | Math Clip Art--Applications of Equivalent Ratios--Vehicle Ratios 1TopicRatios DescriptionThis math clip art image is a title card for a series of math clip art images that apply equivalent ratios problems. The subsequent images show different vehicle ratios. This image, along with the overall collection, can be used to teach ratios by comparing the number of cars to other vehicle types or parking spaces. Teachers can use this visual to introduce the concept of part-to-whole ratios, such as the ratio of cars to total vehicles, or part-to-part ratios, like comparing the number of cars to motorcycles or SUVs in subsequent images. |
Ratios and Rates |
|
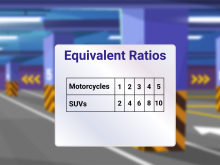
Math Clip Art--Applications of Equivalent Ratios--Vehicle Ratios 10 | Math Clip Art--Applications of Equivalent Ratios--Vehicle Ratios 10TopicRatios DescriptionThis math clip art image displays a table with two rows labeled "Motorcycles" and "SUVs". The numbers in the table are 1, 2, 3, 4, 5 for Motorcycles and 2, 4, 6, 8, 10 for SUVs. This visual representation is crucial for teaching the concept of equivalent ratios using a different set of vehicles. |
Ratios and Rates |
|
Math Clip Art--Applications of Equivalent Ratios--Vehicle Ratios 11 | Math Clip Art--Applications of Equivalent Ratios--Vehicle Ratios 11 This is a collection of clip art images that show equivalent ratios based on numbers of vehicles. |
Ratios and Rates |
|
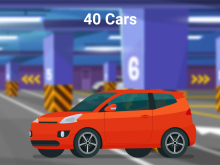
Math Clip Art--Applications of Equivalent Ratios--Vehicle Ratios 2 | Math Clip Art--Applications of Equivalent Ratios--Vehicle Ratios 2TopicRatios DescriptionThis math clip art image showcases a red car in a parking garage with numbered pillars in the background. The caption "40 Cars" provides context for the ratio concept being illustrated. This image is part of a series designed to teach equivalent ratios using vehicles as a relatable subject matter. |
Ratios and Rates |
|
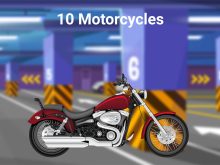
Math Clip Art--Applications of Equivalent Ratios--Vehicle Ratios 3 | Math Clip Art--Applications of Equivalent Ratios--Vehicle Ratios 3TopicRatios DescriptionThis math clip art image depicts a red motorcycle in a parking garage with numbered pillars in the background. The caption "10 Motorcycles" provides essential information for understanding ratios in the context of vehicles. This image is part of a series designed to teach equivalent ratios using different types of vehicles. |
Ratios and Rates |

|
Math Clip Art--Applications of Equivalent Ratios--Vehicle Ratios 4 | Math Clip Art--Applications of Equivalent Ratios--Vehicle Ratios 4TopicRatios DescriptionThis math clip art image showcases a black SUV in a parking garage with numbered pillars in the background. The caption "20 SUVs" provides crucial information for understanding ratios in the context of different vehicle types. This image is part of a series designed to teach equivalent ratios using various vehicles as relatable examples. |
Ratios and Rates |
|
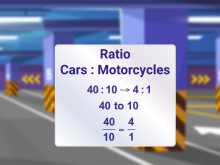
Math Clip Art--Applications of Equivalent Ratios--Vehicle Ratios 5 | Math Clip Art--Applications of Equivalent Ratios--Vehicle Ratios 5TopicRatios DescriptionThis math clip art image displays a parking garage background with a sign showing the ratio of cars to motorcycles. The ratio is presented as 40:10 and then simplified to 4:1. This visual representation is crucial in teaching the concept of equivalent ratios and ratio simplification. |
Ratios and Rates |
|
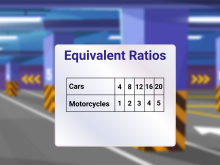
Math Clip Art--Applications of Equivalent Ratios--Vehicle Ratios 6 | Math Clip Art--Applications of Equivalent Ratios--Vehicle Ratios 6TopicRatios DescriptionThis math clip art image presents a table showing equivalent ratios of cars to motorcycles. The table displays five pairs of values: 4:1, 8:2, 12:3, 16:4, and 20:5. This visual representation is instrumental in teaching the concept of equivalent ratios and how they scale up while maintaining the same proportional relationship. |
Ratios and Rates |
|
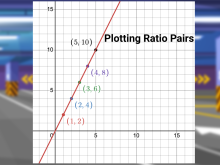
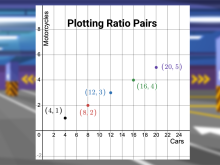
Math Clip Art--Applications of Equivalent Ratios--Vehicle Ratios 7 | Math Clip Art--Applications of Equivalent Ratios--Vehicle Ratios 7TopicRatios DescriptionThis math clip art image presents a graph plotting ratio pairs with cars on the x-axis and motorcycles on the y-axis. The points (4, 1), (8, 2), (12, 3), (16, 4), and (20, 5) are plotted on the coordinate plane. This visual representation is crucial in teaching the concept of equivalent ratios and their graphical interpretation. |
Ratios and Rates |
|
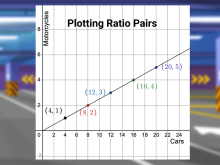
Math Clip Art--Applications of Equivalent Ratios--Vehicle Ratios 8 | Math Clip Art--Applications of Equivalent Ratios--Vehicle Ratios 8TopicRatios DescriptionThis math clip art image presents another graph plotting the same ratio pairs as before, but with a line connecting them to show the linear relationship. This visual representation is crucial for teaching the concept of equivalent ratios and their graphical interpretation in a more comprehensive manner. |
Ratios and Rates |
|
Math Clip Art--Applications of Equivalent Ratios--Vehicle Ratios 9 | Math Clip Art--Applications of Equivalent Ratios--Vehicle Ratios 9TopicRatios DescriptionThis math clip art image presents a table with two rows labeled "SUVs" and "Cars". The numbers in the table are 1, 2, 3, 4, 5 for SUVs and 2, 4, 6, 8, 10 for Cars. This visual representation is essential for teaching the concept of equivalent ratios in a tabular format. |
Ratios and Rates |
|
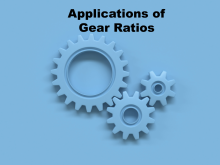
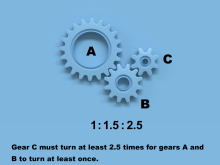
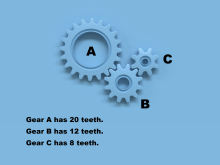
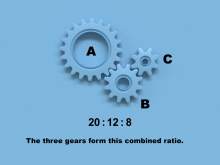
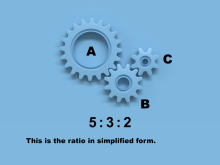
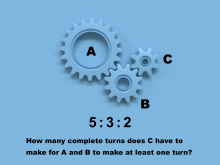
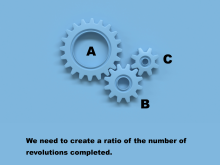
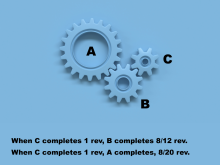
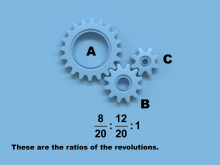
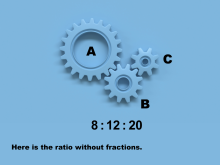
Math Clip Art--Applications of Gear Ratios 1 | Math Clip Art--Applications of Gear Ratios 1 This is a collection of clip art images that show an application of ratios and proportional reasoning in the context of gear ratios. |
Ratios and Rates and Proportions |
|
Math Clip Art--Applications of Gear Ratios 10 | Math Clip Art--Applications of Gear Ratios 10 This is a collection of clip art images that show an application of ratios and proportional reasoning in the context of gear ratios. |
Ratios and Rates and Proportions |
|
Math Clip Art--Applications of Gear Ratios 11 | Math Clip Art--Applications of Gear Ratios 11 This is a collection of clip art images that show an application of ratios and proportional reasoning in the context of gear ratios. |
Ratios and Rates and Proportions |
|
Math Clip Art--Applications of Gear Ratios 12 | Math Clip Art--Applications of Gear Ratios 12 This is a collection of clip art images that show an application of ratios and proportional reasoning in the context of gear ratios. |
Ratios and Rates and Proportions |
|
Math Clip Art--Applications of Gear Ratios 2 | Math Clip Art--Applications of Gear Ratios 2 This is a collection of clip art images that show an application of ratios and proportional reasoning in the context of gear ratios. |
Ratios and Rates and Proportions |
|
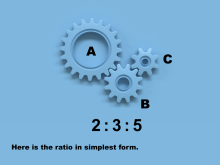
Math Clip Art--Applications of Gear Ratios 3 | Math Clip Art--Applications of Gear Ratios 3 This is a collection of clip art images that show an application of ratios and proportional reasoning in the context of gear ratios. |
Ratios and Rates and Proportions |
|
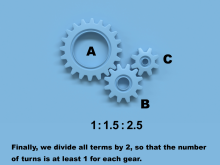
Math Clip Art--Applications of Gear Ratios 4 | Math Clip Art--Applications of Gear Ratios 4 This is a collection of clip art images that show an application of ratios and proportional reasoning in the context of gear ratios. |
Ratios and Rates and Proportions |
|
Math Clip Art--Applications of Gear Ratios 5 | Math Clip Art--Applications of Gear Ratios 5 This is a collection of clip art images that show an application of ratios and proportional reasoning in the context of gear ratios. |
Ratios and Rates and Proportions |
|
Math Clip Art--Applications of Gear Ratios 6 | Math Clip Art--Applications of Gear Ratios 6 This is a collection of clip art images that show an application of ratios and proportional reasoning in the context of gear ratios. |
Ratios and Rates and Proportions |
|
Math Clip Art--Applications of Gear Ratios 7 | Math Clip Art--Applications of Gear Ratios 7 This is a collection of clip art images that show an application of ratios and proportional reasoning in the context of gear ratios. |
Ratios and Rates and Proportions |
|
Math Clip Art--Applications of Gear Ratios 8 | Math Clip Art--Applications of Gear Ratios 8 This is a collection of clip art images that show an application of ratios and proportional reasoning in the context of gear ratios. |
Ratios and Rates and Proportions |
|
Math Clip Art--Applications of Gear Ratios 9 | Math Clip Art--Applications of Gear Ratios 9 This is a collection of clip art images that show an application of ratios and proportional reasoning in the context of gear ratios. |
Ratios and Rates and Proportions |
|
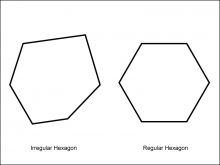
Math Clip Art--Geometry Concepts--Polygons--Hexagon | Math Clip Art--Polygons--HexagonTopicGeometry Concepts DescriptionThis image illustrates two hexagons: one regular and one irregular. A hexagon is a six-sided polygon. In a regular hexagon, all sides and angles are equal, with each interior angle measuring 120 degrees. This symmetry gives it a balanced and uniform appearance. An irregular hexagon, by contrast, has sides and angles that are not all equal. This lack of uniformity means that the hexagon can take on a variety of shapes, depending on the specific lengths and angles of its sides. |
Definition of a Polygon |
|
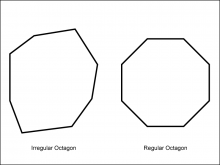
Math Clip Art--Geometry Concepts--Polygons--Octagon | Math Clip Art--Polygons--OctagonTopicGeometry Concepts DescriptionThis image shows two octagons: one regular and one irregular. An octagon is an eight-sided polygon. In a regular octagon, all sides and angles are equal, with each interior angle measuring 135 degrees. This regularity gives it a symmetrical and balanced appearance. An irregular octagon, on the other hand, has sides and angles that are not all equal. This asymmetry means that the octagon can have a variety of shapes, depending on the specific lengths and angles of its sides. |
Definition of a Polygon |
|
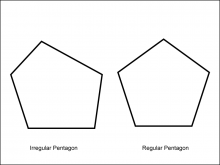
Math Clip Art--Geometry Concepts--Polygons--Pentagon | Math Clip Art--Polygons--PentagonTopicGeometry Concepts DescriptionThis image depicts two pentagons: one regular and one irregular. A pentagon is a five-sided polygon. In a regular pentagon, all sides and angles are equal, with each interior angle measuring 108 degrees. This regularity gives it a symmetrical and balanced appearance. An irregular pentagon, however, has sides and angles that are not all equal. This asymmetry allows the pentagon to take on various shapes, depending on the specific lengths and angles of its sides. |
Definition of a Polygon |
|
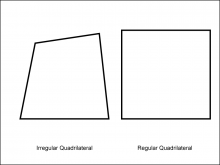
Math Clip Art--Geometry Concepts--Polygons--Quadrilateral | Math Clip Art--Polygons--QuadrilateralTopicGeometry Concepts DescriptionThis image illustrates two quadrilaterals: one regular and one irregular. A quadrilateral is a four-sided polygon. In a regular quadrilateral, such as a square, all sides and angles are equal, with each interior angle measuring 90 degrees. This regularity gives it a symmetrical and balanced appearance. An irregular quadrilateral, however, has sides and angles that are not all equal. This asymmetry allows the quadrilateral to take on various shapes, depending on the specific lengths and angles of its sides. |
Definition of a Polygon |