
Illustrative Math Alignment: Grade 8 Unit 3
Linear Relationships
Lesson 5: Introduction to Linear Relationships
Use the following Media4Math resources with this Illustrative Math lesson.
| Thumbnail Image | Title | Body | Curriculum Topic |
|---|---|---|---|
|
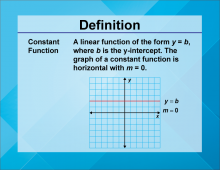
Definition--Linear Function Concepts--Constant Function | Constant Function
TopicLinear Functions DefinitionA constant function is a linear function of the form f(x) = b, where b is a constant. The graph of a constant function is a horizontal line. DescriptionConstant functions are a fundamental concept in linear functions. They represent scenarios where the output value remains unchanged, regardless of the input value. This is depicted graphically as a horizontal line, indicating that the function's rate of change is zero. In real-world applications, constant functions can model situations where a quantity remains steady over time. For example, a flat fee service charge that does not vary with usage can be represented as a constant function. |
Slope-Intercept Form |
|
|
Definition--Linear Function Concepts--Constant Function | Constant Function
TopicLinear Functions DefinitionA constant function is a linear function of the form f(x) = b, where b is a constant. The graph of a constant function is a horizontal line. DescriptionConstant functions are a fundamental concept in linear functions. They represent scenarios where the output value remains unchanged, regardless of the input value. This is depicted graphically as a horizontal line, indicating that the function's rate of change is zero. In real-world applications, constant functions can model situations where a quantity remains steady over time. For example, a flat fee service charge that does not vary with usage can be represented as a constant function. |
Slope-Intercept Form |
|
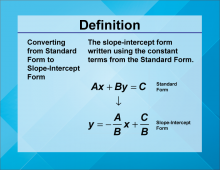
Definition--Linear Function Concepts--Converting from Standard Form to Slope-Intercept Form | Converting from Standard Form to Slope-Intercept Form
TopicLinear Functions DefinitionConverting from standard form to slope-intercept form involves rewriting a linear equation from the form Ax + By = C to the form y = mx + b, where m is the slope and b is the y-intercept. DescriptionConverting linear equations from standard form to slope-intercept form is a key skill in algebra. This conversion allows for easier graphing and interpretation of the equation's slope and y-intercept. |
Slope-Intercept Form |
|
|
Definition--Linear Function Concepts--Converting from Standard Form to Slope-Intercept Form | Converting from Standard Form to Slope-Intercept Form
TopicLinear Functions DefinitionConverting from standard form to slope-intercept form involves rewriting a linear equation from the form Ax + By = C to the form y = mx + b, where m is the slope and b is the y-intercept. DescriptionConverting linear equations from standard form to slope-intercept form is a key skill in algebra. This conversion allows for easier graphing and interpretation of the equation's slope and y-intercept. |
Slope-Intercept Form |
|
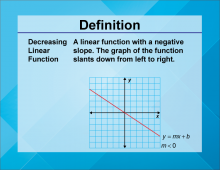
Definition--Linear Function Concepts--Decreasing Linear Function | Decreasing Linear Function
TopicLinear Functions DefinitionA decreasing linear function is a linear function where the slope is negative, indicating that as the input value increases, the output value decreases. DescriptionDecreasing linear functions are important in understanding how variables inversely relate to each other. The negative slope signifies a reduction in the dependent variable as the independent variable increases. Real-world examples include depreciation of assets over time or the decrease in temperature as altitude increases. These functions help model scenarios where an increase in one quantity results in a decrease in another. |
Slope-Intercept Form |
|
|
Definition--Linear Function Concepts--Decreasing Linear Function | Decreasing Linear Function
TopicLinear Functions DefinitionA decreasing linear function is a linear function where the slope is negative, indicating that as the input value increases, the output value decreases. DescriptionDecreasing linear functions are important in understanding how variables inversely relate to each other. The negative slope signifies a reduction in the dependent variable as the independent variable increases. Real-world examples include depreciation of assets over time or the decrease in temperature as altitude increases. These functions help model scenarios where an increase in one quantity results in a decrease in another. |
Slope-Intercept Form |
|
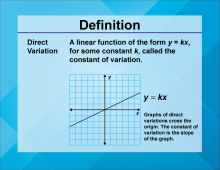
Definition--Linear Function Concepts--Direct Variation | Direct Variation
TopicLinear Functions DefinitionDirect variation describes a linear relationship between two variables where one variable is a constant multiple of the other, expressed as y = kx, where k is the constant of variation. DescriptionDirect variation is a fundamental concept in linear functions, illustrating how one variable changes proportionally with another. The constant of variation, k, represents the rate of change. In real-world scenarios, direct variation can model relationships such as speed and distance, where distance traveled varies directly with time at a constant speed. Understanding this concept is crucial in fields like physics and engineering. |
Slope-Intercept Form |
|
|
Definition--Linear Function Concepts--Direct Variation | Direct Variation
TopicLinear Functions DefinitionDirect variation describes a linear relationship between two variables where one variable is a constant multiple of the other, expressed as y = kx, where k is the constant of variation. DescriptionDirect variation is a fundamental concept in linear functions, illustrating how one variable changes proportionally with another. The constant of variation, k, represents the rate of change. In real-world scenarios, direct variation can model relationships such as speed and distance, where distance traveled varies directly with time at a constant speed. Understanding this concept is crucial in fields like physics and engineering. |
Slope-Intercept Form |
|
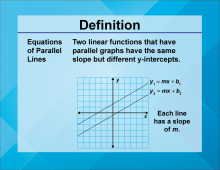
Definition--Linear Function Concepts--Equations of Parallel Lines | Equations of Parallel Lines
TopicLinear Functions DefinitionEquations of parallel lines are linear equations that have the same slope but different y-intercepts, indicating that the lines never intersect. DescriptionUnderstanding equations of parallel lines is crucial in geometry and algebra. Parallel lines have identical slopes, which means they run in the same direction and never meet. In real-world applications, parallel lines can model scenarios such as railway tracks or lanes on a highway, where maintaining a consistent distance is essential. |
Slope-Intercept Form |
|
|
Definition--Linear Function Concepts--Equations of Parallel Lines | Equations of Parallel Lines
TopicLinear Functions DefinitionEquations of parallel lines are linear equations that have the same slope but different y-intercepts, indicating that the lines never intersect. DescriptionUnderstanding equations of parallel lines is crucial in geometry and algebra. Parallel lines have identical slopes, which means they run in the same direction and never meet. In real-world applications, parallel lines can model scenarios such as railway tracks or lanes on a highway, where maintaining a consistent distance is essential. |
Slope-Intercept Form |
|
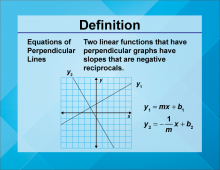
Definition--Linear Function Concepts--Equations of Perpendicular Lines | Equations of Perpendicular Lines
TopicLinear Functions DefinitionEquations of perpendicular lines are linear equations where the slopes are negative reciprocals of each other, indicating that the lines intersect at a right angle. DescriptionEquations of perpendicular lines are significant in both geometry and algebra. The negative reciprocal relationship between their slopes ensures that the lines intersect at a 90-degree angle. In real-world applications, perpendicular lines are found in various structures, such as the intersection of streets or the corners of a building, where right angles are essential. |
Slope-Intercept Form |
|
|
Definition--Linear Function Concepts--Equations of Perpendicular Lines | Equations of Perpendicular Lines
TopicLinear Functions DefinitionEquations of perpendicular lines are linear equations where the slopes are negative reciprocals of each other, indicating that the lines intersect at a right angle. DescriptionEquations of perpendicular lines are significant in both geometry and algebra. The negative reciprocal relationship between their slopes ensures that the lines intersect at a 90-degree angle. In real-world applications, perpendicular lines are found in various structures, such as the intersection of streets or the corners of a building, where right angles are essential. |
Slope-Intercept Form |
|
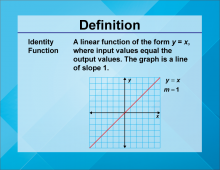
Definition--Linear Function Concepts--Identity Function | Identity Function
TopicLinear Functions DefinitionAn identity function is a linear function of the form f(x) = x, where the output is equal to the input for all values of x. DescriptionThe identity function is a basic yet crucial concept in linear functions. It represents a scenario where the input value is always equal to the output value, graphically depicted as a 45-degree line passing through the origin. In real-world applications, the identity function can model situations where input and output are directly proportional and identical, such as converting units of the same measure. This also introduces the concept of identity, which is fundamental to mathematics. |
Slope-Intercept Form |
|
|
Definition--Linear Function Concepts--Identity Function | Identity Function
TopicLinear Functions DefinitionAn identity function is a linear function of the form f(x) = x, where the output is equal to the input for all values of x. DescriptionThe identity function is a basic yet crucial concept in linear functions. It represents a scenario where the input value is always equal to the output value, graphically depicted as a 45-degree line passing through the origin. In real-world applications, the identity function can model situations where input and output are directly proportional and identical, such as converting units of the same measure. This also introduces the concept of identity, which is fundamental to mathematics. |
Slope-Intercept Form |
|
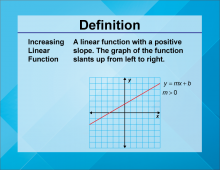
Definition--Linear Function Concepts--Increasing Linear Function | Increasing Linear Function
TopicLinear Functions DefinitionAn increasing linear function is a linear function where the slope is positive, indicating that as the input value increases, the output value also increases. DescriptionIncreasing linear functions are essential in understanding how variables positively relate to each other. The positive slope signifies an increase in the dependent variable as the independent variable increases. Real-world examples include income increasing with hours worked or the rise in temperature with the increase in daylight hours. These functions help model scenarios where an increase in one quantity results in an increase in another. |
Slope-Intercept Form |
|
|
Definition--Linear Function Concepts--Increasing Linear Function | Increasing Linear Function
TopicLinear Functions DefinitionAn increasing linear function is a linear function where the slope is positive, indicating that as the input value increases, the output value also increases. DescriptionIncreasing linear functions are essential in understanding how variables positively relate to each other. The positive slope signifies an increase in the dependent variable as the independent variable increases. Real-world examples include income increasing with hours worked or the rise in temperature with the increase in daylight hours. These functions help model scenarios where an increase in one quantity results in an increase in another. |
Slope-Intercept Form |
|
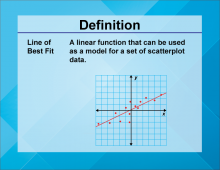
Definition--Linear Function Concepts--Line of Best Fit | Line of Best Fit
TopicLinear Functions DefinitionA line of best fit is a straight line that best represents the data on a scatter plot, showing the trend of the data points. DescriptionThe line of best fit is a crucial concept in statistics and data analysis. It helps in identifying the trend and making predictions based on the data. In real-world applications, the line of best fit is used in various fields such as economics, biology, and engineering to analyze trends and make forecasts. For example, it can be used to predict future sales based on past data. |
Graphs of Linear Functions |
|
|
Definition--Linear Function Concepts--Line of Best Fit | Line of Best Fit
TopicLinear Functions DefinitionA line of best fit is a straight line that best represents the data on a scatter plot, showing the trend of the data points. DescriptionThe line of best fit is a crucial concept in statistics and data analysis. It helps in identifying the trend and making predictions based on the data. In real-world applications, the line of best fit is used in various fields such as economics, biology, and engineering to analyze trends and make forecasts. For example, it can be used to predict future sales based on past data. |
Graphs of Linear Functions |
|
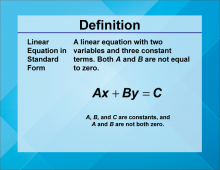
Definition--Linear Function Concepts--Linear Equations in Standard Form | Linear Equations in Standard Form
TopicLinear Functions DefinitionLinear equations in standard form are written as Ax + By = C, where A, B, and C are constants, and A and B are not both zero. DescriptionLinear equations in standard form are a fundamental representation of linear functions. They provide a way to express linear relationships in a general form. |
Standard Form |
|
|
Definition--Linear Function Concepts--Linear Equations in Standard Form | Linear Equations in Standard Form
TopicLinear Functions DefinitionLinear equations in standard form are written as Ax + By = C, where A, B, and C are constants, and A and B are not both zero. DescriptionLinear equations in standard form are a fundamental representation of linear functions. They provide a way to express linear relationships in a general form. |
Standard Form |
|
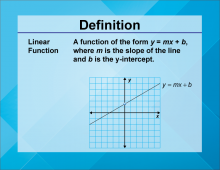
Definition--Linear Function Concepts--Linear Function | Linear Function
TopicLinear Functions DefinitionA linear function is a function that can be graphed as a straight line, typically written in the form y = mx + b, where m is the slope and b is the y-intercept. DescriptionLinear functions are one of the most fundamental concepts in mathematics. They describe relationships where the rate of change between variables is constant, represented graphically as a straight line. This simplicity makes them a central topic in algebra and calculus. |
Slope-Intercept Form |
|
|
Definition--Linear Function Concepts--Linear Function | Linear Function
TopicLinear Functions DefinitionA linear function is a function that can be graphed as a straight line, typically written in the form y = mx + b, where m is the slope and b is the y-intercept. DescriptionLinear functions are one of the most fundamental concepts in mathematics. They describe relationships where the rate of change between variables is constant, represented graphically as a straight line. This simplicity makes them a central topic in algebra and calculus. |
Slope-Intercept Form |
|
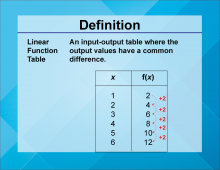
Definition--Linear Function Concepts--Linear Function Tables | Linear Function Tables
TopicLinear Functions DefinitionLinear function tables display the input-output pairs of a linear function, showing how the dependent variable changes with the independent variable. DescriptionLinear function tables are useful tools for understanding and analyzing linear relationships. They provide a clear way to see how changes in the input (independent variable) affect the output (dependent variable). |
Applications of Linear Functions and Graphs of Linear Functions |
|
|
Definition--Linear Function Concepts--Linear Function Tables | Linear Function Tables
TopicLinear Functions DefinitionLinear function tables display the input-output pairs of a linear function, showing how the dependent variable changes with the independent variable. DescriptionLinear function tables are useful tools for understanding and analyzing linear relationships. They provide a clear way to see how changes in the input (independent variable) affect the output (dependent variable). |
Applications of Linear Functions and Graphs of Linear Functions |
|
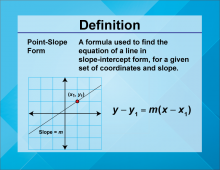
Definition--Linear Function Concepts--Point-Slope Form | Point-Slope Form
TopicLinear Functions DefinitionPoint-slope form of a linear equation is written as y − y1 = m(x−x1 ), where m is the slope and (x1 ,y1) is a point on the line. DescriptionThe point-slope form is a versatile way to express linear equations, especially useful when you know a point on the line and the slope. It allows for quick construction of the equation of a line. |
Point-Slope Form |
|
|
Definition--Linear Function Concepts--Point-Slope Form | Point-Slope Form
TopicLinear Functions DefinitionPoint-slope form of a linear equation is written as y − y1 = m(x−x1 ), where m is the slope and (x1 ,y1) is a point on the line. DescriptionThe point-slope form is a versatile way to express linear equations, especially useful when you know a point on the line and the slope. It allows for quick construction of the equation of a line. |
Point-Slope Form |
|
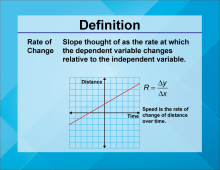
Definition--Linear Function Concepts--Rate of Change | Rate of Change
TopicLinear Functions DefinitionRate of change in a linear function is the ratio of the change in the dependent variable to the change in the independent variable, often represented as the slope m in the equation y = mx + b. DescriptionRate of change is a fundamental concept in understanding linear functions. It describes how one variable changes in relation to another, and is graphically represented by the slope of a line. |
Slope |
|
|
Definition--Linear Function Concepts--Rate of Change | Rate of Change
TopicLinear Functions DefinitionRate of change in a linear function is the ratio of the change in the dependent variable to the change in the independent variable, often represented as the slope m in the equation y = mx + b. DescriptionRate of change is a fundamental concept in understanding linear functions. It describes how one variable changes in relation to another, and is graphically represented by the slope of a line. |
Slope |
|
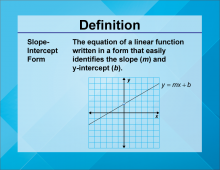
Definition--Linear Function Concepts--Slope-Intercept Form | Slope-Intercept Form
TopicLinear Functions DefinitionSlope-intercept form of a linear equation is written as y = mx + b, where m is the slope and b is the y-intercept. DescriptionSlope-intercept form is one of the most commonly used forms of linear equations. It provides a clear way to understand the slope and y-intercept of a line, making it easier to graph and interpret. In real-world applications, slope-intercept form is used in various fields such as economics, physics, and engineering to model linear relationships. For example, it can represent the relationship between cost and production levels in business. |
Slope-Intercept Form |
|
|
Definition--Linear Function Concepts--Slope-Intercept Form | Slope-Intercept Form
TopicLinear Functions DefinitionSlope-intercept form of a linear equation is written as y = mx + b, where m is the slope and b is the y-intercept. DescriptionSlope-intercept form is one of the most commonly used forms of linear equations. It provides a clear way to understand the slope and y-intercept of a line, making it easier to graph and interpret. In real-world applications, slope-intercept form is used in various fields such as economics, physics, and engineering to model linear relationships. For example, it can represent the relationship between cost and production levels in business. |
Slope-Intercept Form |
|
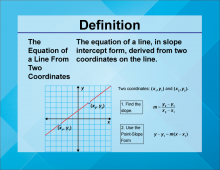
Definition--Linear Function Concepts--The Equation of a Line From Two Coordinates | The Equation of a Line From Two Coordinates
TopicLinear Functions DefinitionThe equation of a line from two coordinates can be determined by finding the slope between the two points and using it in the point-slope form of a linear equation. DescriptionFinding the equation of a line from two coordinates is a fundamental skill in algebra. It involves calculating the slope between the two points and then using one of the points to form the equation in point-slope or slope-intercept form. |
Point-Slope Form |
|
|
Definition--Linear Function Concepts--The Equation of a Line From Two Coordinates | The Equation of a Line From Two Coordinates
TopicLinear Functions DefinitionThe equation of a line from two coordinates can be determined by finding the slope between the two points and using it in the point-slope form of a linear equation. DescriptionFinding the equation of a line from two coordinates is a fundamental skill in algebra. It involves calculating the slope between the two points and then using one of the points to form the equation in point-slope or slope-intercept form. |
Point-Slope Form |
|
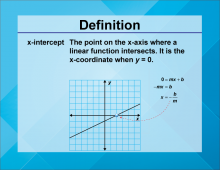
Definition--Linear Function Concepts--x-Intercept | x-Intercept
TopicLinear Functions DefinitionThe x-intercept is the point where a graph crosses the x-axis, indicating the value of x when 𝑦 y is zero. DescriptionThe x-intercept is a key concept in understanding the behavior of linear functions. It represents the point where the function's output is zero, providing insight into the function's roots and behavior. In real-world applications, the x-intercept can be used to determine break-even points in business, where revenue equals costs, or to find the time at which a process starts or stops. |
Slope-Intercept Form |
|
|
Definition--Linear Function Concepts--x-Intercept | x-Intercept
TopicLinear Functions DefinitionThe x-intercept is the point where a graph crosses the x-axis, indicating the value of x when 𝑦 y is zero. DescriptionThe x-intercept is a key concept in understanding the behavior of linear functions. It represents the point where the function's output is zero, providing insight into the function's roots and behavior. In real-world applications, the x-intercept can be used to determine break-even points in business, where revenue equals costs, or to find the time at which a process starts or stops. |
Slope-Intercept Form |
|
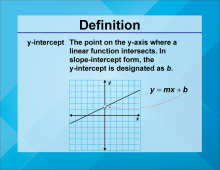
Definition--Linear Function Concepts--y-Intercept | y-Intercept
TopicLinear Functions DefinitionThe y-intercept is the point where a graph crosses the y-axis, indicating the value of y when x is zero. DescriptionThe y-intercept is a fundamental concept in understanding the behavior of linear functions. It represents the initial value of the function when the input is zero, providing insight into the function's starting point. In real-world applications, the y-intercept can be used to determine initial conditions in various scenarios, such as the starting balance in a bank account or the initial position of an object in motion. |
Slope-Intercept Form |
|
|
Definition--Linear Function Concepts--y-Intercept | y-Intercept
TopicLinear Functions DefinitionThe y-intercept is the point where a graph crosses the y-axis, indicating the value of y when x is zero. DescriptionThe y-intercept is a fundamental concept in understanding the behavior of linear functions. It represents the initial value of the function when the input is zero, providing insight into the function's starting point. In real-world applications, the y-intercept can be used to determine initial conditions in various scenarios, such as the starting balance in a bank account or the initial position of an object in motion. |
Slope-Intercept Form |
|
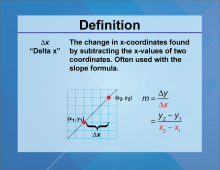
Definition--Slope Concepts--Delta x | Delta xTopicSlope DefinitionDelta x is the change in the x-coordinate in a linear relationship. DescriptionThe term Delta x is fundamental to understanding slope as it represents the horizontal change in a line’s position. In real-world applications, Delta x can represent the distance traveled over time in physics and engineering contexts. |
Slope |
|
|
Definition--Slope Concepts--Delta x | Delta xTopicSlope DefinitionDelta x is the change in the x-coordinate in a linear relationship. DescriptionThe term Delta x is fundamental to understanding slope as it represents the horizontal change in a line’s position. In real-world applications, Delta x can represent the distance traveled over time in physics and engineering contexts. |
Slope |
|
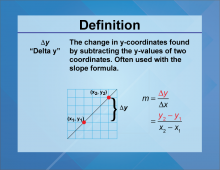
Definition--Slope Concepts--Delta y | Delta yTopicSlope DefinitionDelta y is the change in the y-coordinate in a linear relationship. DescriptionThe term Delta y signifies the vertical change, essential for calculating slope used in graphing and data interpretation. In practical scenarios, Delta y can illustrate changes in temperature over time or the rise in elevation in geography. |
Slope |
|
|
Definition--Slope Concepts--Delta y | Delta yTopicSlope DefinitionDelta y is the change in the y-coordinate in a linear relationship. DescriptionThe term Delta y signifies the vertical change, essential for calculating slope used in graphing and data interpretation. In practical scenarios, Delta y can illustrate changes in temperature over time or the rise in elevation in geography. |
Slope |
|
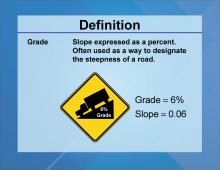
Definition--Slope Concepts--Grade | GradeTopicSlope DefinitionGrade is a ratio indicating the steepness of a slope. DescriptionThe term Grade commonly refers to the angle of elevation or slope expressed as a percentage. In engineering, grades are crucial for designing roads and railways, ensuring safety and efficiency. |
Slope |
|
|
Definition--Slope Concepts--Grade | GradeTopicSlope DefinitionGrade is a ratio indicating the steepness of a slope. DescriptionThe term Grade commonly refers to the angle of elevation or slope expressed as a percentage. In engineering, grades are crucial for designing roads and railways, ensuring safety and efficiency. |
Slope |
|
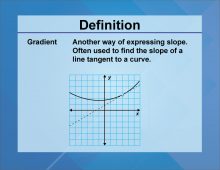
Definition--Slope Concepts--Gradient | GradientTopicSlope DefinitionGradient represents the rate of change of a quantity. DescriptionThe Gradient measures how steep a line is, calculated by the ratio of the rise to run. This concept is significant in fields like physics and economics where gradients can represent relationships between variables. |
Slope |
|
|
Definition--Slope Concepts--Gradient | GradientTopicSlope DefinitionGradient represents the rate of change of a quantity. DescriptionThe Gradient measures how steep a line is, calculated by the ratio of the rise to run. This concept is significant in fields like physics and economics where gradients can represent relationships between variables. |
Slope |
|
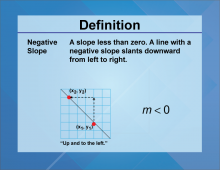
Definition--Slope Concepts--Negative Slope | Negative SlopeTopicSlope DefinitionNegative Slope indicates a decrease in value as x increases. DescriptionThe Negative Slope signifies that as one variable increases, the other decreases, often used in economics to depict inverse relationships. This term finds relevance in real-world scenarios like demand curves which slope downwards. |
Slope |