
Illustrative Math Alignment: Grade 7 Unit 7
Expressions, Equations, and Inequalities
Lesson 12: Solving Problems about Percent Increase or Decrease
Use the following Media4Math resources with this Illustrative Math lesson.
| Thumbnail Image | Title | Body | Curriculum Topic |
|---|---|---|---|
|
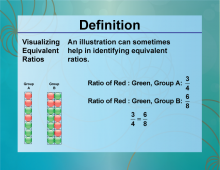
Definition--Ratios, Proportions, and Percents Concepts--Visualizing Equivalent Ratios | Visualizing Equivalent RatiosTopicRatios, Proportions, and Percents DefinitionVisualizing equivalent ratios involves using diagrams or models to show that two ratios are equivalent. DescriptionVisualizing equivalent ratios is important in fields such as mathematics and engineering, where understanding proportional relationships is crucial. For example, using a double number line or a ratio table can help illustrate that the ratios 2:3 and 4:6 are equivalent. |
Ratios and Rates |
|
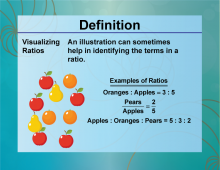
Definition--Ratios, Proportions, and Percents Concepts--Visualizing Ratios | Visualizing RatiosTopicRatios, Proportions, and Percents DefinitionVisualizing ratios involves using diagrams or models to represent and understand the relationship between two quantities. DescriptionVisualizing ratios is essential in various fields, such as mathematics, science, and economics, where understanding the relationship between quantities is crucial. For example, using a bar model or a double number line can help illustrate the ratio of 3:4. |
Ratios and Rates |

|
Instructional Resource--Strategy Pack--Percent of a Number | Instructional Resource | Strategy Pack | Percent of a Number
Learn different strategies for finding the percent of a number. The Strategy Packs provide alternate ways of solving the same problem, giving your students different approaches to the same problem. The goal of the Strategy Packs is to encourage your students to think strategically when solving math problems. —PRESS PREVIEW TO LAUNCH THE PRESENTATION— To see the complete collection of Instructional Resources, click on this link.Note: The download is a PPT file. |
Percents |

|
Instructional Resource--Strategy Pack--The Number That Is a Given Percent of Another Number | Instructional Resource | Strategy Pack | The Number Whose Percent Is Another Number
Learn different strategies for finding the number that is a given percentage of another number. The Strategy Packs provide alternate ways of solving the same problem, giving your students different approaches to the same problem. The goal of the Strategy Packs is to encourage your students to think strategically when solving math problems. —PRESS PREVIEW TO LAUNCH THE PRESENTATION— To see the complete collection of Instructional Resources, click on this link.Note: The download is a PPT file. |
Percents |

|
Instructional Resource--Strategy Pack--The Percent One Number Is of Another | Instructional Resource | Strategy Pack | The Percent One Number Is of Another
Learn different strategies for finding the percent one number is of another. The Strategy Packs provide alternate ways of solving the same problem, giving your students different approaches to the same problem. The goal of the Strategy Packs is to encourage your students to think strategically when solving math problems. —PRESS PREVIEW TO LAUNCH THE PRESENTATION— To see the complete collection of Instructional Resources, click on this link.Note: The download is a PPT file. |
Percents |

|
Instructional Resource--Strategy Pack--Percent One Number Is of Another | Instructional Resource | Strategy Pack | The Percent One Number Is of Another Learn different strategies for finding the percent one number is of another. The Strategy Packs provide alternate ways of solving the same problem, giving your students different approaches to the same problem. The goal of the Strategy Packs is to encourage your students to think strategically when solving math problems. —PRESS PREVIEW TO LAUNCH THE PRESENTATION—To see the complete collection of Instructional Resources, click on this link.Note: The download is a PPT file. |
Percents |

|
Lesson Plan--Ratios, Proportions, and Percents (Gr 6)--Lesson 1--Introduction to Ratios | Lesson Plan: Introduction to Ratios In this foundational lesson, students embark on a journey to understand the concept of ratios, a crucial building block in mathematics that compares two or more quantities. Through engaging activities and practical examples, learners will: |
Ratios and Rates |

|
Lesson Plan--Ratios, Proportions, and Percents (Gr 6)--Lesson 2--Equivalent Ratios and Proportional Relationships | Lesson Plan: Equivalent Ratios and Proportional Relationships In this lesson, students will deepen their understanding of equivalent ratios and their role in proportional reasoning. By exploring real-world applications, students will develop the skills to recognize, create, and use equivalent ratios in practical situations. The lesson introduces multiple strategies for working with equivalent ratios, including ratio tables, scaling up and down, and solving problems using proportional reasoning. Key components of this lesson include: |
Ratios and Rates and Applications of Ratios, Proportions, and Percents |

|
Lesson Plan--Ratios, Proportions, and Percents (Gr 6)--Lesson 3--Solving Ratio and Rate Problems | Lesson Plan: Understanding Ratios and Rates This lesson introduces sixth-grade students to ratios and rates, emphasizing their applications in real-world problem-solving. Through hands-on activities, students will learn how to calculate unit rates, interpret proportional relationships, and analyze data using tables and graphs. |
Applications of Ratios, Proportions, and Percents |

|
Lesson Plan--Ratios, Proportions, and Percents (Gr 6)--Lesson 4--Percents and Measurement | Lesson Plan: Percents and Measurement This comprehensive lesson plan is designed to introduce sixth-grade students to the concept of percents, emphasizing their relationship to fractions and decimals. Through engaging activities, detailed examples, and practical applications, students will develop a strong foundation in interpreting and solving percent problems in various real-world contexts. |
Percents |

|
Lesson Plan--Ratios, Proportions, and Percents (Gr 6)--Lesson 5--Applying Ratios and Proportional Reasoning | Lesson Plan: Applying Ratios and Proportional Reasoning This lesson plan is designed to provide sixth-grade students with a comprehensive understanding of ratios, proportions, and percents. Through engaging activities, hands-on explorations, and real-world applications, learners develop essential skills in comparing quantities, scaling figures up or down, and converting between fractions, decimals, and percents. This lesson emphasizes critical thinking and problem-solving strategies that help students apply mathematical reasoning to everyday situations, such as adjusting recipes, budgeting, and analyzing data. Key topics covered in this lesson include: |
Applications of Ratios, Proportions, and Percents |

|
Lesson Plan--Ratios, Proportions, and Percents (Gr 7)--Lesson 1--Introduction to Ratios and Unit Rates | Lesson Plan: Introduction to Ratios and Unit Rates This lesson introduces seventh-grade students to ratios and unit rates, emphasizing their real-world applications. Through engaging activities and problem-solving exercises, students will develop proportional reasoning skills. |
Ratios and Rates |

|
Lesson Plan--Ratios, Proportions, and Percents (Gr 7)--Lesson 2--Unit Rates and Complex Fractions | Lesson Plan: Unit Rates and Complex Fractions This lesson introduces seventh-grade students to unit rates and complex fractions, helping them develop a deeper understanding of proportional relationships and fraction operations. Students will learn to compute unit rates with fractional quantities, simplify complex fractions, and apply these skills to real-world situations such as speed calculations, recipe adjustments, and measurement conversions. |
Ratios and Rates and Applications of Ratios, Proportions, and Percents |

|
Lesson Plan--Ratios, Proportions, and Percents (Gr 7)--Lesson 3--Identifying Proportional Relationships | Lesson Plan: Identifying Proportional Relationships In this engaging Grade 7 math lesson, students will explore how to recognize and analyze proportional relationships. Using tables and graphs, learners will determine whether two quantities are proportional and identify the constant of proportionality. This lesson aligns with Common Core Standard 7.RP.A.2 and helps students build foundational skills in ratio and proportion concepts. Topics covered include: Recognizing proportional relationships in tables and graphsUnderstanding the constant of proportionalityIdentifying linear relationships that pass through the originSubscribers to Media4Math can download this lesson in PDF format for easy classroom use. |
Proportions and Applications of Linear Functions |

|
Lesson Plan--Ratios, Proportions, and Percents (Gr 7)--Lesson 4--Representing Proportional Relationships | Lesson Plan: Representing Proportional RelationshipsLesson SummaryIn this lesson, students will explore different ways to represent proportional relationships using tables, graphs, and equations. They will analyze proportional relationships in real-world contexts and learn how to determine the constant of proportionality. The lesson emphasizes how proportional relationships appear as linear functions that pass through the origin when graphed. Students will practice: |
Proportions |

|
Lesson Plan--Ratios, Proportions, and Percents (Gr 7)--Lesson 5--Solving Multi-Step Ratio and Percent Problems | Lesson Plan: Solving Multi-Step Ratio Problems In this lesson, students will develop their problem-solving skills by tackling multi-step ratio and proportion problems. They will learn how to analyze complex ratio scenarios, apply proportional reasoning, and use unit conversions to solve real-world problems. This lesson builds on students' understanding of ratios and proportions, reinforcing their ability to work through multi-step calculations with confidence. Key concepts covered in this lesson include: |
Applications of Ratios, Proportions, and Percents |
|
Lesson Plan--Ratios, Proportions, and Percents (Gr 8)--Lesson 1--Understanding Ratios, Proportional Relationships, and Rational Numbers | Lesson Plan: Ratios and Proportional Relationships In this lesson, students explore ratios and proportional relationships, building on their prior knowledge to deepen their understanding of proportional reasoning. They will analyze proportional relationships in tables, graphs, and equations while identifying the constant of proportionality and its significance in real-world applications. Key concepts covered in this lesson include: |
Ratios and Rates, Percents and Proportions |

|
Lesson Plan--Ratios, Proportions, and Percents (Gr 8)--Lesson 2--Solving Percent Problems Using Proportional Reasoning | Lesson Plan: Solving Percent Problems In this lesson, students will develop their problem-solving skills by learning multiple strategies for solving percent problems. Using proportions and equations, they will calculate percent increase, percent decrease, discounts, taxes, commissions, and simple interest. This lesson builds on proportional reasoning skills and applies them to real-world financial and mathematical situations. Key concepts covered in this lesson include: |
Percents |

|
Lesson Plan--Ratios, Proportions, and Percents (Gr 8)--Lesson 3--Graphing and Interpreting Proportional Relationships | Lesson Plan: Graphing and Interpreting Proportional Relationships In this lesson, students will explore how to represent and analyze proportional relationships using graphs, tables, and equations. They will learn that proportional relationships follow the equation y=kx, where k is the constant of proportionality, and that these relationships always form a straight line passing through the origin on a coordinate plane. Key concepts covered in this lesson include: |
Applications of Ratios, Proportions, and Percents and Proportions |

|
Lesson Plan--Ratios, Proportions, and Percents (Gr 8)--Lesson 4--Understanding Direct Variation and Its Connection to Proportional Relationships | Lesson Plan: Direct Variations In this lesson, students will explore direct variation, a special type of proportional relationship where one variable is a constant multiple of another. They will learn how to identify direct variation in tables, graphs, and equations, determine the constant of variation (k), and understand how direct variation relates to linear functions. Key concepts covered in this lesson include: |
Applications of Linear Functions and Applications of Ratios, Proportions, and Percents |
|
Lesson Plan--Ratios, Proportions, and Percents (Gr 8)--Lesson 5--Analyzing and Comparing Linear Relationships, Including Parallel and Perpendicular Lines | Lesson Plan: Parallel and Perpendicular Lines In this lesson, students explore the properties of parallel and perpendicular lines in coordinate geometry. They will learn how to identify these lines based on their slopes, determine equations for parallel and perpendicular lines, and apply these concepts to solve real-world and mathematical problems. Key concepts covered in this lesson include: |
Graphs of Linear Functions |
|
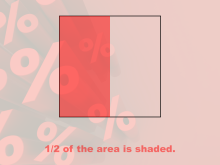
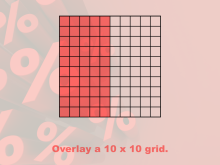
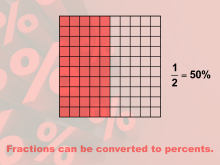
Math Clip Art--Percent Visualizations 1 | Math Clip Art--Percent Visualizations 1 This is a collection of clip art images that show visual models for percents. |
Ratios and Rates and Percents |
|
Math Clip Art--Percent Visualizations 2 | Math Clip Art--Percent Visualizations 2 This is a collection of clip art images that show visual models for percents. |
Ratios and Rates and Percents |
|
Math Clip Art--Percent Visualizations 3 | Math Clip Art--Percent Visualizations 3 This is a collection of clip art images that show visual models for percents. |
Ratios and Rates and Percents |

|
Math Clip Art--Percent Visualizations 4 | Math Clip Art--Percent Visualizations 4 This is a collection of clip art images that show visual models for percents. |
Ratios and Rates and Percents |

|
Math Clip Art--Percent Visualizations 5 | Math Clip Art--Percent Visualizations 5 This is a collection of clip art images that show visual models for percents. |
Ratios and Rates and Percents |
|
Math Clip Art--Percent Visualizations 6 | Math Clip Art--Percent Visualizations 6 This is a collection of clip art images that show visual models for percents. |
Ratios and Rates and Percents |
|
Math Clip Art--Percent Visualizations 7 | Math Clip Art--Percent Visualizations 7 This is a collection of clip art images that show visual models for percents. |
Ratios and Rates and Percents |
|
Math Clip Art--Percent Visualizations 8 | Math Clip Art--Percent Visualizations 8 This is a collection of clip art images that show visual models for percents. |
Ratios and Rates and Percents |
|
Math Clip Art--Percent Visualizations 9 | Math Clip Art--Percent Visualizations 9 This is a collection of clip art images that show visual models for percents. |
Ratios and Rates and Percents |
|
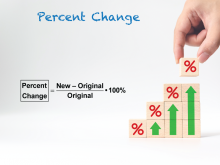
Math Clip Art--Ratios, Proportions, Percents--Percent Change 01 | Math Clip Art--Ratios, Proportions, Percents--Percent Change 01TopicRatios, Proportions, and Percents DescriptionThe image introduces the concept of percent change with the formula: Percent Change = (New - Original) / Original * 100%. It establishes the formula as the foundation for understanding percent change throughout the sequence. Math clip art provides a visual and engaging way to explore complex mathematical concepts such as percent change. These examples illustrate how numbers, fractions, and percentages are interconnected, helping to build students' numerical reasoning skills. |
Percents |
|
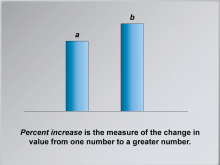
Math Clip Art--Ratios, Proportions, Percents--Percent Change 02 | Math Clip Art--Ratios, Proportions, Percents--Percent Change 02TopicRatios, Proportions, and Percents DescriptionThis image explains that percent increase measures the change from one number to a greater number. It provides context for when to apply the concept of percent increase in real-life scenarios. Math clip art provides a visual and engaging way to explore complex mathematical concepts such as percent change. These examples illustrate how numbers, fractions, and percentages are interconnected, helping to build students' numerical reasoning skills. |
Percents |
|
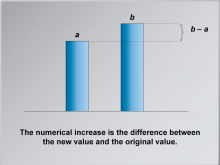
Math Clip Art--Ratios, Proportions, Percents--Percent Change 03 | Math Clip Art--Ratios, Proportions, Percents--Percent Change 03TopicRatios, Proportions, and Percents DescriptionThis image highlights that the numerical increase is the difference between the new and original values. It adds clarity by breaking down the calculation into a numerical difference. Math clip art provides a visual and engaging way to explore complex mathematical concepts such as percent change. These examples illustrate how numbers, fractions, and percentages are interconnected, helping to build students' numerical reasoning skills. |
Percents |
|
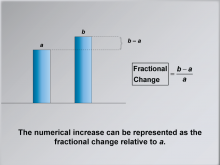
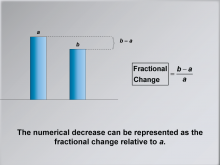
Math Clip Art--Ratios, Proportions, Percents--Percent Change 04 | Math Clip Art--Ratios, Proportions, Percents--Percent Change 04TopicRatios, Proportions, and Percents DescriptionThis image demonstrates how numerical increase is represented as fractional change using the formula: (b - a) / a. It bridges numerical increase to fractional change, setting up for conversion to percent increase. Math clip art provides a visual and engaging way to explore complex mathematical concepts such as percent change. These examples illustrate how numbers, fractions, and percentages are interconnected, helping to build students' numerical reasoning skills. |
Percents |
|
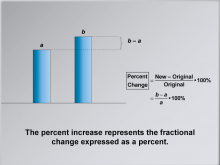
Math Clip Art--Ratios, Proportions, Percents--Percent Change 05 | Math Clip Art--Ratios, Proportions, Percents--Percent Change 05TopicRatios, Proportions, and Percents DescriptionThis image shows the formula for percent change as a fractional change expressed as a percentage: (b - a) / a * 100%. It reinforces the connection between fractional change and percent increase as part of the calculation process. Math clip art provides a visual and engaging way to explore complex mathematical concepts such as percent change. These examples illustrate how numbers, fractions, and percentages are interconnected, helping to build students' numerical reasoning skills. |
Percents |
|
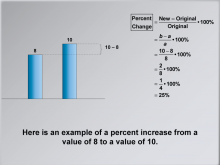
Math Clip Art--Ratios, Proportions, Percents--Percent Change 06 | Math Clip Art--Ratios, Proportions, Percents--Percent Change 06TopicRatios, Proportions, and Percents DescriptionThis image provides an example of a percent increase calculation from 8 to 10, resulting in 25%. It offers a practical example to illustrate how the formula is applied to real numbers. Math clip art provides a visual and engaging way to explore complex mathematical concepts such as percent change. These examples illustrate how numbers, fractions, and percentages are interconnected, helping to build students' numerical reasoning skills. |
Percents |
|
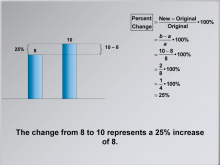
Math Clip Art--Ratios, Proportions, Percents--Percent Change 07 | Math Clip Art--Ratios, Proportions, Percents--Percent Change 07TopicRatios, Proportions, and Percents DescriptionThis image reiterates the example calculation, emphasizing that the change from 8 to 10 is a 25% increase. It reinforces understanding by repeating the example with emphasis on the interpretation of the result. Math clip art provides a visual and engaging way to explore complex mathematical concepts such as percent change. These examples illustrate how numbers, fractions, and percentages are interconnected, helping to build students' numerical reasoning skills. |
Percents |
|
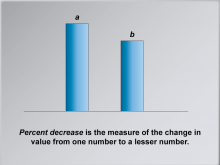
Math Clip Art--Ratios, Proportions, Percents--Percent Change 08 | Math Clip Art--Ratios, Proportions, Percents--Percent Change 08TopicRatios, Proportions, and Percents DescriptionThis image defines percent decrease as the change from one number to a lesser number. It introduces the complementary concept of percent decrease to show both directions of percent change. Math clip art provides a visual and engaging way to explore complex mathematical concepts such as percent change. These examples illustrate how numbers, fractions, and percentages are interconnected, helping to build students' numerical reasoning skills. |
Percents |
|
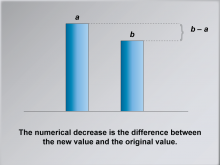
Math Clip Art--Ratios, Proportions, Percents--Percent Change 09 | Math Clip Art--Ratios, Proportions, Percents--Percent Change 09TopicRatios, Proportions, and Percents DescriptionThis image explains that numerical decrease is the difference between the new and original values. It mirrors the earlier explanation of numerical increase, ensuring consistency in presenting both cases. Math clip art provides a visual and engaging way to explore complex mathematical concepts such as percent change. These examples illustrate how numbers, fractions, and percentages are interconnected, helping to build students' numerical reasoning skills. |
Percents |
|
Math Clip Art--Ratios, Proportions, Percents--Percent Change 10 | Math Clip Art--Ratios, Proportions, Percents--Percent Change 10TopicRatios, Proportions, and Percents DescriptionThis image demonstrates fractional change for a decrease using the formula: (b - a) / a. It completes the explanation of percent change by connecting numerical decrease to fractional representation. Math clip art provides a visual and engaging way to explore complex mathematical concepts such as percent change. These examples illustrate how numbers, fractions, and percentages are interconnected, helping to build students' numerical reasoning skills. |
Percents |
|
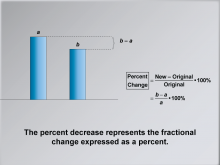
Math Clip Art--Ratios, Proportions, Percents--Percent Change 11 | Math Clip Art--Ratios, Proportions, Percents--Percent Change 11TopicRatios, Proportions, and Percents DescriptionThis image explains that percent decrease represents fractional change expressed as a percentage: (b - a) / a * 100%. It extends the explanation to show how fractional change can be converted to percent decrease. Math clip art provides a visual and engaging way to explore complex mathematical concepts such as percent change. These examples illustrate how numbers, fractions, and percentages are interconnected, helping to build students' numerical reasoning skills. |
Percents |
|
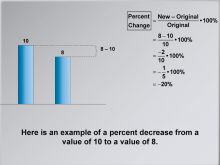
Math Clip Art--Ratios, Proportions, Percents--Percent Change 12 | Math Clip Art--Ratios, Proportions, Percents--Percent Change 12TopicRatios, Proportions, and Percents DescriptionThis image provides an example of a percent decrease calculation from 10 to 8, resulting in -20%. It offers a practical example illustrating the application of the formula to calculate percent decrease. Math clip art provides a visual and engaging way to explore complex mathematical concepts such as percent change. These examples illustrate how numbers, fractions, and percentages are interconnected, helping to build students' numerical reasoning skills. |
Percents |
|
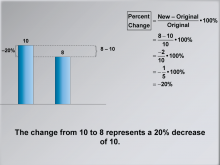
Math Clip Art--Ratios, Proportions, Percents--Percent Change 13 | Math Clip Art--Ratios, Proportions, Percents--Percent Change 13TopicRatios, Proportions, and Percents DescriptionThis image reiterates the example, emphasizing that the change from 10 to 8 represents a 20% decrease. It reinforces understanding by summarizing the example with focus on the final interpretation of the result. Math clip art provides a visual and engaging way to explore complex mathematical concepts such as percent change. These examples illustrate how numbers, fractions, and percentages are interconnected, helping to build students' numerical reasoning skills. |
Percents |
|
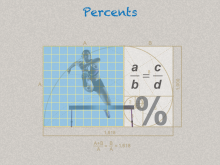
Math Clip Art--Ratios, Proportions, Percents--Percents 01 | Math Clip Art--Ratios, Proportions, Percents--Percents 01TopicRatios, Proportions, and Percents DescriptionThe image illustrates the concept of an introductory image that visually connects percents with proportions, showcasing a grid and a formula (a / b = c / d) next to a hurdler and a large percent sign. The golden ratio a / b = 1.618 is also present, symbolizing relationships, and expands on this idea by showing that serves as a thematic and conceptual introduction to percents by emphasizing proportional relationships and the idea of ratios. |
Percents |
|
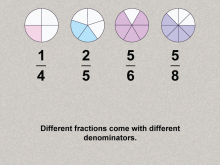
Math Clip Art--Ratios, Proportions, Percents--Percents 02 | Math Clip Art--Ratios, Proportions, Percents--Percents 02TopicRatios, Proportions, and Percents DescriptionThe image illustrates the concept of fractions with different denominators: 1/4, 2/5, 5/6, and 5/8, each depicted as shaded portions of circles. and expands on this idea by showing that highlights the challenge of comparing fractions with different denominators, setting up the need for a common framework such as percents. |
Percents |
|
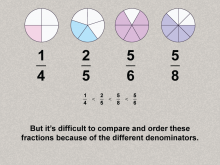
Math Clip Art--Ratios, Proportions, Percents--Percents 03 | Math Clip Art--Ratios, Proportions, Percents--Percents 03TopicRatios, Proportions, and Percents DescriptionThe image illustrates the concept of and expands on the previous image by comparing and ordering the fractions using inequality symbols: 1/4 < 2/5 < 5/8 < 5/6. This image expands on this idea by emphasizing the difficulty of comparing fractions and transitions to the rationale for using percents as a standard for comparison. |
Percents |
|
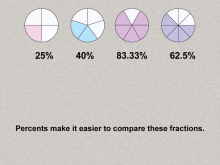
Math Clip Art--Ratios, Proportions, Percents--Percents 04 | Math Clip Art--Ratios, Proportions, Percents--Percents 04TopicRatios, Proportions, and Percents DescriptionThe image illustrates the concept of converting the fractions 1/4, 2/5, 5/6, and 5/8 into percents (25%, 40%, 83.33%, 62.5%) with their corresponding pie diagrams. It expands on this idea by showing that introduces percents as an easier method for comparing fractions by representing them with a common denominator of 100. |
Percents |
|
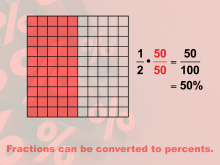
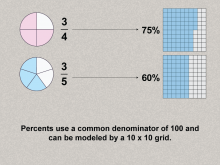
Math Clip Art--Ratios, Proportions, Percents--Percents 05 | Math Clip Art--Ratios, Proportions, Percents--Percents 05TopicRatios, Proportions, and Percents DescriptionThe image illustrates the concept of how fractions such as 3/4 and 3/5 convert to percents (75% and 60%) using shaded 10 x 10 grids. It expands on this idea by showing the concept of percents using a visual and tangible representation, reinforcing the idea of 100 as the base for comparison. |
Percents |
|
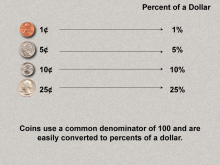
Math Clip Art--Ratios, Proportions, Percents--Percents 06 | Math Clip Art--Ratios, Proportions, Percents--Percents 06TopicRatios, Proportions, and Percents DescriptionThe image illustrates the concept of connecting coins (1¢, 5¢, 10¢, 25¢) to their percent values of a dollar (1%, 5%, 10%, 25%). It expands on this idea by establishing a real-world application of percents, showing their utility in everyday contexts like money. The topic of Ratios, Proportions, and Percents explores fundamental math concepts by using practical examples. This collection aids in visualizing the connection between different mathematical forms such as ratios, percents, and fractions, making abstract concepts more accessible to students. |
Percents |
|
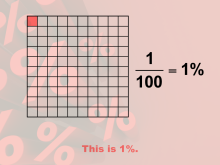
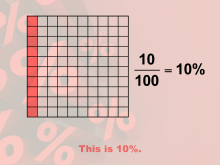
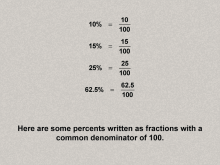
Math Clip Art--Ratios, Proportions, Percents--Percents 07 | Math Clip Art--Ratios, Proportions, Percents--Percents 07TopicRatios, Proportions, and Percents DescriptionThe image illustrates percentages as fractions with a denominator of 100, such as 10% = 10 / 100, 15% = 15 / 100, and so on. It expands on this idea by showing how percents relate to fractions, reinforcing their equivalency and further grounding the concept. The topic of Ratios, Proportions, and Percents explores fundamental math concepts by using practical examples. This collection aids in visualizing the connection between different mathematical forms such as ratios, percents, and fractions, making abstract concepts more accessible to students. |
Percents |