
Illustrative Math Alignment: Grade 7 Unit 9
Putting it All Together
Lesson 4: Restaurant Floor Plan
Use the following Media4Math resources with this Illustrative Math lesson.
| Thumbnail Image | Title | Body | Curriculum Topic |
|---|---|---|---|
|
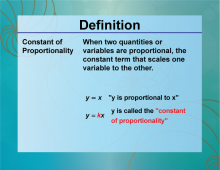
Definition--Ratios, Proportions, and Percents Concepts--The Constant of Proportionality | The Constant of ProportionalityTopicRatios, Proportions, and Percents DefinitionThe constant of proportionality is the constant value that relates two proportional quantities. DescriptionThe constant of proportionality is a fundamental concept in mathematics, particularly in linear relationships and direct variation. For example, in the equation y = kx, k is the constant of proportionality that relates y and x. This concept is crucial in fields like physics, where it is used to describe relationships such as speed (distance/time). |
Proportions |
|
|
Definition--Ratios, Proportions, and Percents Concepts--The Constant of Proportionality | The Constant of ProportionalityTopicRatios, Proportions, and Percents DefinitionThe constant of proportionality is the constant value that relates two proportional quantities. DescriptionThe constant of proportionality is a fundamental concept in mathematics, particularly in linear relationships and direct variation. For example, in the equation y = kx, k is the constant of proportionality that relates y and x. This concept is crucial in fields like physics, where it is used to describe relationships such as speed (distance/time). |
Proportions |
|
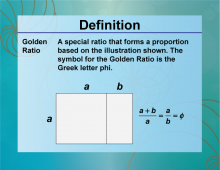
Definition--Ratios, Proportions, and Percents Concepts--The Golden Ratio | The Golden RatioTopicRatios, Proportions, and Percents DefinitionThe Golden Ratio is a special number approximately equal to 1.618, often denoted by the Greek letter φ (phi), which appears in various aspects of art, architecture, and nature. |
Applications of Ratios, Proportions, and Percents and Ratios and Rates |
|
|
Definition--Ratios, Proportions, and Percents Concepts--The Golden Ratio | The Golden RatioTopicRatios, Proportions, and Percents DefinitionThe Golden Ratio is a special number approximately equal to 1.618, often denoted by the Greek letter φ (phi), which appears in various aspects of art, architecture, and nature. |
Applications of Ratios, Proportions, and Percents and Ratios and Rates |
|
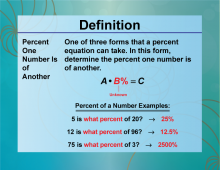
Definition--Ratios, Proportions, and Percents Concepts--The Percent One Number Is of Another | The Percent One Number Is of AnotherTopicRatios, Proportions, and Percents DefinitionThe percent one number is of another is a way to express one number as a percentage of another number. DescriptionUnderstanding how to express one number as a percentage of another is crucial in various real-world applications, such as calculating discounts, tax, and interest rates. For example, if you want to find out what percentage 25 is of 200, you divide 25 by 200 and multiply by 100, resulting in 12.5%. |
Percents |
|
|
Definition--Ratios, Proportions, and Percents Concepts--The Percent One Number Is of Another | The Percent One Number Is of AnotherTopicRatios, Proportions, and Percents DefinitionThe percent one number is of another is a way to express one number as a percentage of another number. DescriptionUnderstanding how to express one number as a percentage of another is crucial in various real-world applications, such as calculating discounts, tax, and interest rates. For example, if you want to find out what percentage 25 is of 200, you divide 25 by 200 and multiply by 100, resulting in 12.5%. |
Percents |
|
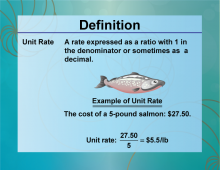
Definition--Ratios, Proportions, and Percents Concepts--Unit Rate | Unit RateTopicRatios, Proportions, and Percents DefinitionA unit rate is a comparison of any two separate but related measurements when one of the measurements is reduced to a single unit. DescriptionUnit rates are commonly used in everyday life, such as calculating speed (miles per hour), cost per item, or efficiency (miles per gallon). For example, if a car travels 300 miles on 10 gallons of gas, the unit rate is 30 miles per gallon. |
Ratios and Rates |
|
|
Definition--Ratios, Proportions, and Percents Concepts--Unit Rate | Unit RateTopicRatios, Proportions, and Percents DefinitionA unit rate is a comparison of any two separate but related measurements when one of the measurements is reduced to a single unit. DescriptionUnit rates are commonly used in everyday life, such as calculating speed (miles per hour), cost per item, or efficiency (miles per gallon). For example, if a car travels 300 miles on 10 gallons of gas, the unit rate is 30 miles per gallon. |
Ratios and Rates |
|
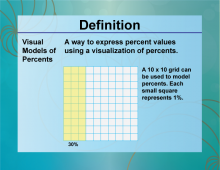
Definition--Ratios, Proportions, and Percents Concepts--Visual Models for Percents | Visual Models for PercentsTopicRatios, Proportions, and Percents DefinitionVisual models for percents are diagrams or illustrations that represent percentages to help visualize and understand them. DescriptionVisual models for percents are useful tools in various fields, such as education, finance, and statistics, to represent data and make it more comprehensible. For example, pie charts and bar graphs are common visual models that help illustrate percentages and proportions effectively. |
Percents |
|
|
Definition--Ratios, Proportions, and Percents Concepts--Visual Models for Percents | Visual Models for PercentsTopicRatios, Proportions, and Percents DefinitionVisual models for percents are diagrams or illustrations that represent percentages to help visualize and understand them. DescriptionVisual models for percents are useful tools in various fields, such as education, finance, and statistics, to represent data and make it more comprehensible. For example, pie charts and bar graphs are common visual models that help illustrate percentages and proportions effectively. |
Percents |
|
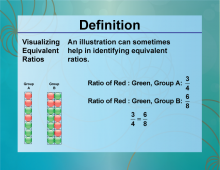
Definition--Ratios, Proportions, and Percents Concepts--Visualizing Equivalent Ratios | Visualizing Equivalent RatiosTopicRatios, Proportions, and Percents DefinitionVisualizing equivalent ratios involves using diagrams or models to show that two ratios are equivalent. DescriptionVisualizing equivalent ratios is important in fields such as mathematics and engineering, where understanding proportional relationships is crucial. For example, using a double number line or a ratio table can help illustrate that the ratios 2:3 and 4:6 are equivalent. |
Ratios and Rates |
|
|
Definition--Ratios, Proportions, and Percents Concepts--Visualizing Equivalent Ratios | Visualizing Equivalent RatiosTopicRatios, Proportions, and Percents DefinitionVisualizing equivalent ratios involves using diagrams or models to show that two ratios are equivalent. DescriptionVisualizing equivalent ratios is important in fields such as mathematics and engineering, where understanding proportional relationships is crucial. For example, using a double number line or a ratio table can help illustrate that the ratios 2:3 and 4:6 are equivalent. |
Ratios and Rates |
|
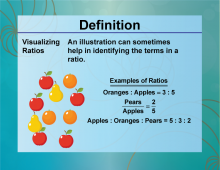
Definition--Ratios, Proportions, and Percents Concepts--Visualizing Ratios | Visualizing RatiosTopicRatios, Proportions, and Percents DefinitionVisualizing ratios involves using diagrams or models to represent and understand the relationship between two quantities. DescriptionVisualizing ratios is essential in various fields, such as mathematics, science, and economics, where understanding the relationship between quantities is crucial. For example, using a bar model or a double number line can help illustrate the ratio of 3:4. |
Ratios and Rates |
|
|
Definition--Ratios, Proportions, and Percents Concepts--Visualizing Ratios | Visualizing RatiosTopicRatios, Proportions, and Percents DefinitionVisualizing ratios involves using diagrams or models to represent and understand the relationship between two quantities. DescriptionVisualizing ratios is essential in various fields, such as mathematics, science, and economics, where understanding the relationship between quantities is crucial. For example, using a bar model or a double number line can help illustrate the ratio of 3:4. |
Ratios and Rates |

|
Instructional Resource--Strategy Pack--Percent One Number Is of Another | Instructional Resource | Strategy Pack | The Percent One Number Is of Another Learn different strategies for finding the percent one number is of another. The Strategy Packs provide alternate ways of solving the same problem, giving your students different approaches to the same problem. The goal of the Strategy Packs is to encourage your students to think strategically when solving math problems. —PRESS PREVIEW TO LAUNCH THE PRESENTATION—To see the complete collection of Instructional Resources, click on this link.Note: The download is a PPT file. |
Percents |

|
INSTRUCTIONAL RESOURCE: Algebra Application: Cicada Cycles | INSTRUCTIONAL RESOURCE: Algebra Application: Cicada Cycles
In this Algebra Application, students study the life cycles of 13- and 17-year cicadas, as well as the populations of bird predators. Students develop a mathematical model using spreadsheets and investigate why the prime number life cycles help the cicadas. The math topics covered include: Mathematical modeling, Data gathering and analysis, Percent increase and decrease, Prime numbers and composites. This real world application of math concepts will engage your students. |
Applications of Ratios, Proportions, and Percents, Percents and Numerical Expressions |
|
|
INSTRUCTIONAL RESOURCE: Algebra Application: Cicada Cycles | INSTRUCTIONAL RESOURCE: Algebra Application: Cicada Cycles
In this Algebra Application, students study the life cycles of 13- and 17-year cicadas, as well as the populations of bird predators. Students develop a mathematical model using spreadsheets and investigate why the prime number life cycles help the cicadas. The math topics covered include: Mathematical modeling, Data gathering and analysis, Percent increase and decrease, Prime numbers and composites. This real world application of math concepts will engage your students. |
Applications of Ratios, Proportions, and Percents, Percents and Numerical Expressions |