
Illustrative Math Alignment: Grade 8 Unit 3
Functions and Volume
Lesson 6: Even More Graphs of Functions
Use the following Media4Math resources with this Illustrative Math lesson.
| Thumbnail Image | Title | Body | Curriculum Topic |
|---|---|---|---|

|
Interactive Quiz: Graphs of Linear Functions, Quiz 06, Level 2 | Interactive Quiz: Graphs of Linear Functions, Quiz 06, Level 2
This is part of a collection of math quizzes on the topic of graphs of linear functions. Some quizzes are interactive and some are in PDF format. To see the complete quiz collection on this topic, click on this link. Note: The download is the PDF version of the quiz (with answer key).Related ResourcesTo see additional resources on this topic, click on the Related Resources tab.Quiz LibraryTo see the complete collection of Quizzes, click on this link.
|
Graphs of Linear Functions |
|
|
Interactive Quiz: Graphs of Linear Functions, Quiz 06, Level 3 | Interactive Quiz: Graphs of Linear Functions, Quiz 06, Level 3
This is part of a collection of math quizzes on the topic of graphs of linear functions. Some quizzes are interactive and some are in PDF format. To see the complete quiz collection on this topic, click on this link. Note: The download is the PDF version of the quiz (with answer key).Related ResourcesTo see additional resources on this topic, click on the Related Resources tab.Quiz LibraryTo see the complete collection of Quizzes, click on this link.
|
Graphs of Linear Functions |
|
|
Interactive Quiz: Graphs of Linear Functions, Quiz 07, Level 1 | Interactive Quiz: Graphs of Linear Functions, Quiz 07, Level 1
This is part of a collection of math quizzes on the topic of graphs of linear functions. Some quizzes are interactive and some are in PDF format. To see the complete quiz collection on this topic, click on this link. Note: The download is the PDF version of the quiz (with answer key).Related ResourcesTo see additional resources on this topic, click on the Related Resources tab.Quiz LibraryTo see the complete collection of Quizzes, click on this link.
|
Graphs of Linear Functions |
|
|
Interactive Quiz: Graphs of Linear Functions, Quiz 07, Level 2 | Interactive Quiz: Graphs of Linear Functions, Quiz 07, Level 2
This is part of a collection of math quizzes on the topic of graphs of linear functions. Some quizzes are interactive and some are in PDF format. To see the complete quiz collection on this topic, click on this link. Note: The download is the PDF version of the quiz (with answer key).Related ResourcesTo see additional resources on this topic, click on the Related Resources tab.Quiz LibraryTo see the complete collection of Quizzes, click on this link.
|
Graphs of Linear Functions |
|
|
Interactive Quiz: Graphs of Linear Functions, Quiz 07, Level 3 | Interactive Quiz: Graphs of Linear Functions, Quiz 07, Level 3
This is part of a collection of math quizzes on the topic of graphs of linear functions. Some quizzes are interactive and some are in PDF format. To see the complete quiz collection on this topic, click on this link. Note: The download is the PDF version of the quiz (with answer key).Related ResourcesTo see additional resources on this topic, click on the Related Resources tab.Quiz LibraryTo see the complete collection of Quizzes, click on this link.
|
Graphs of Linear Functions |
|
|
Interactive Quiz: Graphs of Linear Functions, Quiz 08, Level 1 | Interactive Quiz: Graphs of Linear Functions, Quiz 08, Level 1
This is part of a collection of math quizzes on the topic of graphs of linear functions. Some quizzes are interactive and some are in PDF format. To see the complete quiz collection on this topic, click on this link. Note: The download is the PDF version of the quiz (with answer key).Related ResourcesTo see additional resources on this topic, click on the Related Resources tab.Quiz LibraryTo see the complete collection of Quizzes, click on this link.
|
Graphs of Linear Functions |
|
|
Interactive Quiz: Graphs of Linear Functions, Quiz 08, Level 2 | Interactive Quiz: Graphs of Linear Functions, Quiz 08, Level 2
This is part of a collection of math quizzes on the topic of graphs of linear functions. Some quizzes are interactive and some are in PDF format. To see the complete quiz collection on this topic, click on this link. Note: The download is the PDF version of the quiz (with answer key).Related ResourcesTo see additional resources on this topic, click on the Related Resources tab.Quiz LibraryTo see the complete collection of Quizzes, click on this link.
|
Graphs of Linear Functions |
|
|
Interactive Quiz: Graphs of Linear Functions, Quiz 08, Level 3 | Interactive Quiz: Graphs of Linear Functions, Quiz 08, Level 3
This is part of a collection of math quizzes on the topic of graphs of linear functions. Some quizzes are interactive and some are in PDF format. To see the complete quiz collection on this topic, click on this link. Note: The download is the PDF version of the quiz (with answer key).Related ResourcesTo see additional resources on this topic, click on the Related Resources tab.Quiz LibraryTo see the complete collection of Quizzes, click on this link.
|
Graphs of Linear Functions |
|
|
Interactive Quiz: Graphs of Linear Functions, Quiz 09, Level 1 | Interactive Quiz: Graphs of Linear Functions, Quiz 09, Level 1
This is part of a collection of math quizzes on the topic of graphs of linear functions. Some quizzes are interactive and some are in PDF format. To see the complete quiz collection on this topic, click on this link. Note: The download is the PDF version of the quiz (with answer key).Related ResourcesTo see additional resources on this topic, click on the Related Resources tab.Quiz LibraryTo see the complete collection of Quizzes, click on this link.
|
Graphs of Linear Functions |
|
|
Interactive Quiz: Graphs of Linear Functions, Quiz 09, Level 2 | Interactive Quiz: Graphs of Linear Functions, Quiz 09, Level 2
This is part of a collection of math quizzes on the topic of graphs of linear functions. Some quizzes are interactive and some are in PDF format. To see the complete quiz collection on this topic, click on this link. Note: The download is the PDF version of the quiz (with answer key).Related ResourcesTo see additional resources on this topic, click on the Related Resources tab.Quiz LibraryTo see the complete collection of Quizzes, click on this link.
|
Graphs of Linear Functions |
|
|
Interactive Quiz: Graphs of Linear Functions, Quiz 09, Level 3 | Interactive Quiz: Graphs of Linear Functions, Quiz 09, Level 3
This is part of a collection of math quizzes on the topic of graphs of linear functions. Some quizzes are interactive and some are in PDF format. To see the complete quiz collection on this topic, click on this link. Note: The download is the PDF version of the quiz (with answer key).Related ResourcesTo see additional resources on this topic, click on the Related Resources tab.Quiz LibraryTo see the complete collection of Quizzes, click on this link.
|
Graphs of Linear Functions |
|
|
Interactive Quiz: Graphs of Linear Functions, Quiz 10, Level 1 | Interactive Quiz: Graphs of Linear Functions, Quiz 10, Level 1
This is part of a collection of math quizzes on the topic of graphs of linear functions. Some quizzes are interactive and some are in PDF format. To see the complete quiz collection on this topic, click on this link. Note: The download is the PDF version of the quiz (with answer key).Related ResourcesTo see additional resources on this topic, click on the Related Resources tab.Quiz LibraryTo see the complete collection of Quizzes, click on this link.
|
Graphs of Linear Functions |
|
|
Interactive Quiz: Graphs of Linear Functions, Quiz 10, Level 2 | Interactive Quiz: Graphs of Linear Functions, Quiz 10, Level 2
This is part of a collection of math quizzes on the topic of graphs of linear functions. Some quizzes are interactive and some are in PDF format. To see the complete quiz collection on this topic, click on this link. Note: The download is the PDF version of the quiz (with answer key).Related ResourcesTo see additional resources on this topic, click on the Related Resources tab.Quiz LibraryTo see the complete collection of Quizzes, click on this link.
|
Graphs of Linear Functions |
|
|
Interactive Quiz: Graphs of Linear Functions, Quiz 10, Level 3 | Interactive Quiz: Graphs of Linear Functions, Quiz 10, Level 3
This is part of a collection of math quizzes on the topic of graphs of linear functions. Some quizzes are interactive and some are in PDF format. To see the complete quiz collection on this topic, click on this link. Note: The download is the PDF version of the quiz (with answer key).Related ResourcesTo see additional resources on this topic, click on the Related Resources tab.Quiz LibraryTo see the complete collection of Quizzes, click on this link.
|
Graphs of Linear Functions |

|
Lesson Plan--Linear Functions and Equations (HS)--Lesson 2--Graphing Linear Functions | Lesson Plan: Graphing Linear FunctionsLesson SummaryIn this lesson, students will explore different methods for graphing linear functions, strengthening their understanding of how algebraic equations relate to their graphical representations. The lesson covers: Graphing linear functions using slope-intercept form, standard form, and plotting points.Understanding how slope and y-intercept affect the appearance and behavior of a linear graph.Identifying the x-intercept and y-intercept and using them to analyze function behavior.By the end of this lesson, students will be proficient in graphing linear functions and interpreting their meaning in real-world applications. |
Graphs of Linear Functions |

|
Lesson Plan--Linear Functions and Equations (HS)--Lesson 3--Slope and Rate of Change | Lesson Plan: Slope and Rate of Change This comprehensive lesson plan delves into the concept of slope as a measure of the rate of change in linear functions. Students will engage with various representations—graphs, tables, and real-world scenarios—to calculate and interpret slope effectively. The lesson emphasizes contextual understanding, enabling learners to connect mathematical concepts to everyday situations. Key components of the lesson include: |
Slope-Intercept Form, Standard Form and Applications of Linear Functions |
|
Lesson Plan--Linear Functions and Equations (MS)--Lesson 2--Graphing Linear Equations | Lesson Plan: Graphing Linear EquationsThis is the second lesson in a five-part series on linear equations. It introduces students to graphing linear equations using slope-intercept form: y=mx+b. Students will learn to identify slope and y-intercept, plot points, and interpret graphs in real-world contexts. The lesson aligns with Common Core Standards 8.EE.B.5 and 8.EE.B.6. |
Graphs of Linear Functions |

|
Lesson Plan--Ratios, Proportions, and Percents (Gr 8)--Lesson 5--Analyzing and Comparing Linear Relationships, Including Parallel and Perpendicular Lines | Lesson Plan: Parallel and Perpendicular Lines In this lesson, students explore the properties of parallel and perpendicular lines in coordinate geometry. They will learn how to identify these lines based on their slopes, determine equations for parallel and perpendicular lines, and apply these concepts to solve real-world and mathematical problems. Key concepts covered in this lesson include: |
Graphs of Linear Functions |
|
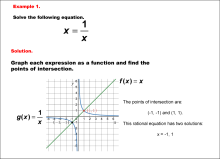
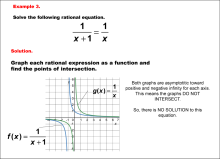
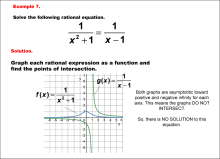
Math Example--Graphical Solutions to Rational Equations--Example 1 | This is part of a collection of math examples that show how to use graphical techniques to solve rational equations.
Note: The download is an image file.
Related ResourcesTo see additional resources on this topic, click on the Related Resources tab.Create a Slide ShowSubscribers can use Slide Show Creator to create a slide show from the complete collection of math examples on this topic. To see the complete clip art collection, click on this Link. To learn more about Slide Show Creator, click on this Link:AccessibilityThis resource can also be used with a screen reader. |
Rational Functions and Equations |
|
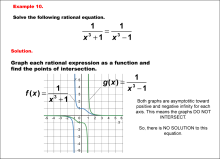
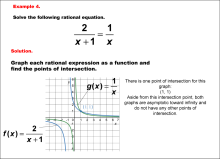
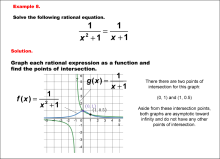
Math Example--Graphical Solutions to Rational Equations--Example 10 | This is part of a collection of math examples that show how to use graphical techniques to solve rational equations.
Note: The download is an image file.
Related ResourcesTo see additional resources on this topic, click on the Related Resources tab.Create a Slide ShowSubscribers can use Slide Show Creator to create a slide show from the complete collection of math examples on this topic. To see the complete clip art collection, click on this Link. To learn more about Slide Show Creator, click on this Link:AccessibilityThis resource can also be used with a screen reader. |
Rational Functions and Equations |
|
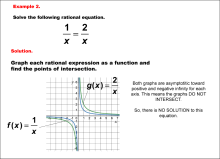
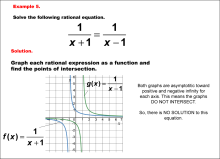
Math Example--Graphical Solutions to Rational Equations--Example 2 | This is part of a collection of math examples that show how to use graphical techniques to solve rational equations.
Note: The download is an image file.
Related ResourcesTo see additional resources on this topic, click on the Related Resources tab.Create a Slide ShowSubscribers can use Slide Show Creator to create a slide show from the complete collection of math examples on this topic. To see the complete clip art collection, click on this Link. To learn more about Slide Show Creator, click on this Link:AccessibilityThis resource can also be used with a screen reader. |
Rational Functions and Equations |
|
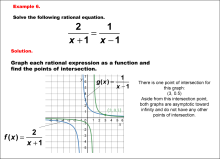
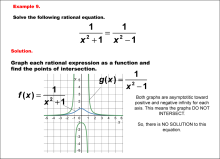
Math Example--Graphical Solutions to Rational Equations--Example 3 | This is part of a collection of math examples that show how to use graphical techniques to solve rational equations.
Note: The download is an image file.
Related ResourcesTo see additional resources on this topic, click on the Related Resources tab.Create a Slide ShowSubscribers can use Slide Show Creator to create a slide show from the complete collection of math examples on this topic. To see the complete clip art collection, click on this Link. To learn more about Slide Show Creator, click on this Link:AccessibilityThis resource can also be used with a screen reader. |
Rational Functions and Equations |
|
Math Example--Graphical Solutions to Rational Equations--Example 4 | This is part of a collection of math examples that show how to use graphical techniques to solve rational equations.
Note: The download is an image file.
Related ResourcesTo see additional resources on this topic, click on the Related Resources tab.Create a Slide ShowSubscribers can use Slide Show Creator to create a slide show from the complete collection of math examples on this topic. To see the complete clip art collection, click on this Link. To learn more about Slide Show Creator, click on this Link:AccessibilityThis resource can also be used with a screen reader. |
Rational Functions and Equations |
|
Math Example--Graphical Solutions to Rational Equations--Example 5 | This is part of a collection of math examples that show how to use graphical techniques to solve rational equations.
Note: The download is an image file.
Related ResourcesTo see additional resources on this topic, click on the Related Resources tab.Create a Slide ShowSubscribers can use Slide Show Creator to create a slide show from the complete collection of math examples on this topic. To see the complete clip art collection, click on this Link. To learn more about Slide Show Creator, click on this Link:AccessibilityThis resource can also be used with a screen reader. |
Rational Functions and Equations |
|
Math Example--Graphical Solutions to Rational Equations--Example 6 | This is part of a collection of math examples that show how to use graphical techniques to solve rational equations.
Note: The download is an image file.
Related ResourcesTo see additional resources on this topic, click on the Related Resources tab.Create a Slide ShowSubscribers can use Slide Show Creator to create a slide show from the complete collection of math examples on this topic. To see the complete clip art collection, click on this Link. To learn more about Slide Show Creator, click on this Link:AccessibilityThis resource can also be used with a screen reader. |
Rational Functions and Equations |
|
Math Example--Graphical Solutions to Rational Equations--Example 7 | This is part of a collection of math examples that show how to use graphical techniques to solve rational equations.
Note: The download is an image file.
Related ResourcesTo see additional resources on this topic, click on the Related Resources tab.Create a Slide ShowSubscribers can use Slide Show Creator to create a slide show from the complete collection of math examples on this topic. To see the complete clip art collection, click on this Link. To learn more about Slide Show Creator, click on this Link:AccessibilityThis resource can also be used with a screen reader. |
Rational Functions and Equations |
|
Math Example--Graphical Solutions to Rational Equations--Example 8 | This is part of a collection of math examples that show how to use graphical techniques to solve rational equations.
Note: The download is an image file.
Related ResourcesTo see additional resources on this topic, click on the Related Resources tab.Create a Slide ShowSubscribers can use Slide Show Creator to create a slide show from the complete collection of math examples on this topic. To see the complete clip art collection, click on this Link. To learn more about Slide Show Creator, click on this Link:AccessibilityThis resource can also be used with a screen reader. |
Rational Functions and Equations |
|
Math Example--Graphical Solutions to Rational Equations--Example 9 | This is part of a collection of math examples that show how to use graphical techniques to solve rational equations.
Note: The download is an image file.
Related ResourcesTo see additional resources on this topic, click on the Related Resources tab.Create a Slide ShowSubscribers can use Slide Show Creator to create a slide show from the complete collection of math examples on this topic. To see the complete clip art collection, click on this Link. To learn more about Slide Show Creator, click on this Link:AccessibilityThis resource can also be used with a screen reader. |
Rational Functions and Equations |
|
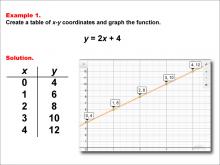
Math Example--Linear Function Concepts--Linear Functions in Tabular and Graph Form: Example 1 | Math Example--Linear Function Concepts--Linear Functions in Tabular and Graph Form: Example 1TopicLinear Functions DescriptionThis example demonstrates how to create a table of x-y coordinates and graph the linear function y = 2x + 4. The image shows both a graph and a table representing this function. The table includes coordinate pairs (0, 4), (1, 6), (2, 8), (3, 10), and (4, 12), illustrating how the y-value increases by 2 for each unit increase in x. |
Graphs of Linear Functions |
|
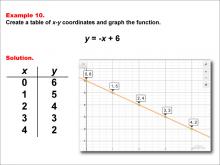
Math Example--Linear Function Concepts--Linear Functions in Tabular and Graph Form: Example 10 | Math Example--Linear Function Concepts--Linear Functions in Tabular and Graph Form: Example 10TopicLinear Functions DescriptionThis example demonstrates how to create a table of x-y coordinates and graph the linear function y = -x + 6. The image shows both a graph and a table representing this function. The table includes coordinate pairs (0, 6), (1, 5), (2, 4), (3, 3), and (4, 2), illustrating how the y-value decreases by 1 for each unit increase in x. |
Graphs of Linear Functions |
|
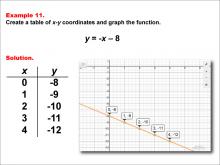
Math Example--Linear Function Concepts--Linear Functions in Tabular and Graph Form: Example 11 | Math Example--Linear Function Concepts--Linear Functions in Tabular and Graph Form: Example 11TopicLinear Functions DescriptionThis example illustrates the process of creating a table of x-y coordinates and graphing the linear function y = -x - 8. The image presents both a graph and a table for this function. The table includes coordinate pairs (0, -8), (1, -9), (2, -10), (3, -11), and (4, -12), showing how the y-value decreases by 1 for each unit increase in x. |
Graphs of Linear Functions |
|
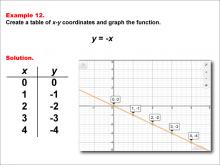
Math Example--Linear Function Concepts--Linear Functions in Tabular and Graph Form: Example 12 | Math Example--Linear Function Concepts--Linear Functions in Tabular and Graph Form: Example 12TopicLinear Functions DescriptionThis example demonstrates the creation of a table of x-y coordinates and the graphing of the linear function y = -x. The image displays both a graph and a table representing this function. The table includes coordinate pairs (0, 0), (1, -1), (2, -2), (3, -3), and (4, -4), illustrating how the y-value decreases by 1 for each unit increase in x. |
Graphs of Linear Functions |
|
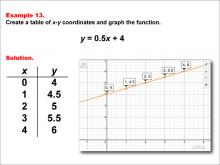
Math Example--Linear Function Concepts--Linear Functions in Tabular and Graph Form: Example 13 | Math Example--Linear Function Concepts--Linear Functions in Tabular and Graph Form: Example 13TopicLinear Functions DescriptionThis example illustrates the process of creating a table of x-y coordinates and graphing the linear function y = 0.5x + 4. The image presents both a graph and a table for this function. The table includes coordinate pairs (0, 4), (1, 4.5), (2, 5), (3, 5.5), and (4, 6), showing how the y-value increases by 0.5 for each unit increase in x. |
Graphs of Linear Functions |
|
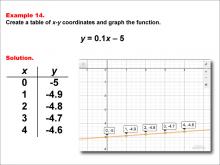
Math Example--Linear Function Concepts--Linear Functions in Tabular and Graph Form: Example 14 | Math Example--Linear Function Concepts--Linear Functions in Tabular and Graph Form: Example 14TopicLinear Functions DescriptionThis example demonstrates how to create a table of x-y coordinates and graph the linear function y = 0.1x - 5. The image shows both a graph and a table representing this function. The table includes coordinate pairs (0, -5), (1, -4.9), (2, -4.8), (3, -4.7), and (4, -4.6), illustrating how the y-value increases by 0.1 for each unit increase in x. |
Graphs of Linear Functions |
|
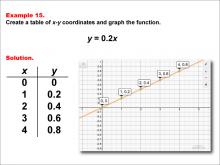
Math Example--Linear Function Concepts--Linear Functions in Tabular and Graph Form: Example 15 | Math Example--Linear Function Concepts--Linear Functions in Tabular and Graph Form: Example 15TopicLinear Functions DescriptionThis example illustrates the process of creating a table of x-y coordinates and graphing the linear function y = 0.2x. The image presents both a graph and a table for this function. The table includes coordinate pairs (0, 0), (1, 0.2), (2, 0.4), (3, 0.6), and (4, 0.8), showing how the y-value increases by 0.2 for each unit increase in x. |
Graphs of Linear Functions |
|
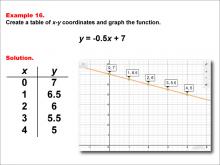
Math Example--Linear Function Concepts--Linear Functions in Tabular and Graph Form: Example 16 | Math Example--Linear Function Concepts--Linear Functions in Tabular and Graph Form: Example 16TopicLinear Functions DescriptionThis example demonstrates how to create a table of x-y coordinates and graph the linear function y = -0.5x + 7. The image shows both a graph and a table representing this function. The table includes coordinate pairs (0, 7), (1, 6.5), (2, 6), (3, 5.5), and (4, 5), illustrating how the y-value decreases by 0.5 for each unit increase in x. |
Graphs of Linear Functions |
|
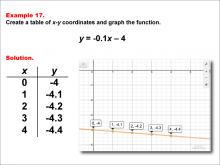
Math Example--Linear Function Concepts--Linear Functions in Tabular and Graph Form: Example 17 | Math Example--Linear Function Concepts--Linear Functions in Tabular and Graph Form: Example 17TopicLinear Functions DescriptionThis example illustrates the process of creating a table of x-y coordinates and graphing the linear function y = -0.1x - 4. The image presents both a graph and a table for this function. The table includes coordinate pairs (0, -4), (1, -4.1), (2, -4.2), (3, -4.3), and (4, -4.4), showing how the y-value decreases by 0.1 for each unit increase in x. |
Graphs of Linear Functions |
|
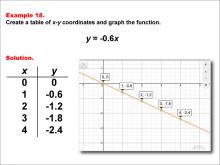
Math Example--Linear Function Concepts--Linear Functions in Tabular and Graph Form: Example 18 | Math Example--Linear Function Concepts--Linear Functions in Tabular and Graph Form: Example 18TopicLinear Functions DescriptionThis example demonstrates how to create a table of x-y coordinates and graph the linear function y = -0.6x. The image shows both a graph and a table representing this function. The table includes coordinate pairs (0, 0), (1, -0.6), (2, -1.2), (3, -1.8), and (4, -2.4), illustrating how the y-value decreases by 0.6 for each unit increase in x. |
Graphs of Linear Functions |
|
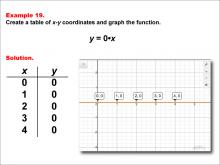
Math Example--Linear Function Concepts--Linear Functions in Tabular and Graph Form: Example 19 | Math Example--Linear Function Concepts--Linear Functions in Tabular and Graph Form: Example 19TopicLinear Functions DescriptionThis example illustrates the process of creating a table of x-y coordinates and graphing the linear function y = 0x. The image presents both a graph and a table for this function. The table includes coordinate pairs (0, 0), (1, 0), (2, 0), (3, 0), and (4, 0), showing how the y-value remains constant at 0 for all values of x. |
Graphs of Linear Functions |
|
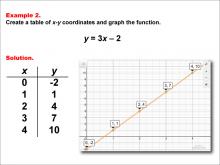
Math Example--Linear Function Concepts--Linear Functions in Tabular and Graph Form: Example 2 | Math Example--Linear Function Concepts--Linear Functions in Tabular and Graph Form: Example 2TopicLinear Functions DescriptionThis example illustrates the process of creating a table of x-y coordinates and graphing the linear function y = 3x - 2. The image presents both a graph and a table for this function. The table includes coordinate pairs (0, -2), (1, 1), (2, 4), (3, 7), and (4, 10), showing how the y-value increases by 3 for each unit increase in x. |
Graphs of Linear Functions |
|
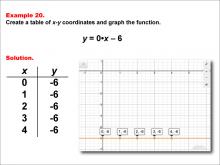
Math Example--Linear Function Concepts--Linear Functions in Tabular and Graph Form: Example 20 | Math Example--Linear Function Concepts--Linear Functions in Tabular and Graph Form: Example 20TopicLinear Functions DescriptionThis example demonstrates how to create a table of x-y coordinates and graph the linear function y = 0x - 6. The image shows both a graph and a table representing this function. The table includes coordinate pairs (0, -6), (1, -6), (2, -6), (3, -6), and (4, -6), illustrating how the y-value remains constant at -6 for all values of x. |
Graphs of Linear Functions |
|
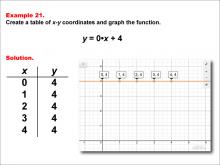
Math Example--Linear Function Concepts--Linear Functions in Tabular and Graph Form: Example 21 | Math Example--Linear Function Concepts--Linear Functions in Tabular and Graph Form: Example 21TopicLinear Functions DescriptionThis example illustrates the process of creating a table of x-y coordinates and graphing the linear function y = 0 * x + 4. The image presents both a graph and a table for this function. The table includes coordinate pairs (0, 4), (1, 4), (2, 4), (3, 4), and (4, 4), showing how the y-value remains constant at 4 for all values of x. |
Graphs of Linear Functions |
|
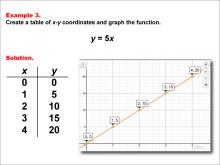
Math Example--Linear Function Concepts--Linear Functions in Tabular and Graph Form: Example 3 | Math Example--Linear Function Concepts--Linear Functions in Tabular and Graph Form: Example 3TopicLinear Functions DescriptionThis example demonstrates the creation of a table of x-y coordinates and the graphing of the linear function y = 5x. The image displays both a graph and a table representing this function. The table includes coordinate pairs (0, 0), (1, 5), (2, 10), (3, 15), and (4, 20), illustrating how the y-value increases by 5 for each unit increase in x. |
Graphs of Linear Functions |
|
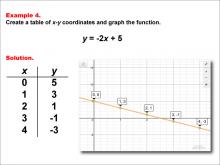
Math Example--Linear Function Concepts--Linear Functions in Tabular and Graph Form: Example 4 | Math Example--Linear Function Concepts--Linear Functions in Tabular and Graph Form: Example 4TopicLinear Functions DescriptionThis example showcases the process of creating a table of x-y coordinates and graphing the linear function y = -2x + 5. The image presents both a graph and a table for this function. The table includes coordinate pairs (0, 5), (1, 3), (2, 1), (3, -1), and (4, -3), demonstrating how the y-value decreases by 2 for each unit increase in x. |
Graphs of Linear Functions |
|
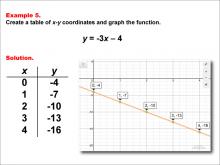
Math Example--Linear Function Concepts--Linear Functions in Tabular and Graph Form: Example 5 | Math Example--Linear Function Concepts--Linear Functions in Tabular and Graph Form: Example 5TopicLinear Functions DescriptionThis example illustrates the creation of a table of x-y coordinates and the graphing of the linear function y = -3x - 4. The image displays both a graph and a table representing this function. The table includes coordinate pairs (0, -4), (1, -7), (2, -10), (3, -13), and (4, -16), showing how the y-value decreases by 3 for each unit increase in x. |
Graphs of Linear Functions |
|
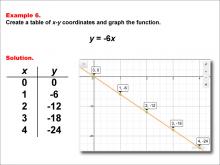
Math Example--Linear Function Concepts--Linear Functions in Tabular and Graph Form: Example 6 | Math Example--Linear Function Concepts--Linear Functions in Tabular and Graph Form: Example 6TopicLinear Functions DescriptionThis example demonstrates how to create a table of x-y coordinates and graph the linear function y = -6x. The image shows both a graph and a table representing this function. The table includes coordinate pairs (0, 0), (1, -6), (2, -12), (3, -18), and (4, -24), illustrating how the y-value decreases by 6 for each unit increase in x. |
Graphs of Linear Functions |
|
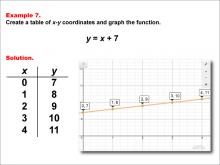
Math Example--Linear Function Concepts--Linear Functions in Tabular and Graph Form: Example 7 | Math Example--Linear Function Concepts--Linear Functions in Tabular and Graph Form: Example 7TopicLinear Functions DescriptionThis example illustrates the process of creating a table of x-y coordinates and graphing the linear function y = x + 7. The image presents both a graph and a table for this function. The table includes coordinate pairs (0, 7), (1, 8), (2, 9), (3, 10), and (4, 11), showing how the y-value increases by 1 for each unit increase in x. |
Graphs of Linear Functions |
|
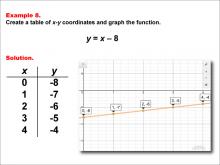
Math Example--Linear Function Concepts--Linear Functions in Tabular and Graph Form: Example 8 | Math Example--Linear Function Concepts--Linear Functions in Tabular and Graph Form: Example 8TopicLinear Functions DescriptionThis example demonstrates the creation of a table of x-y coordinates and the graphing of the linear function y = x - 8. The image displays both a graph and a table representing this function. The table includes coordinate pairs (0, -8), (1, -7), (2, -6), (3, -5), and (4, -4), illustrating how the y-value increases by 1 for each unit increase in x. |
Graphs of Linear Functions |
|
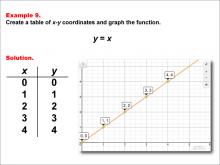
Math Example--Linear Function Concepts--Linear Functions in Tabular and Graph Form: Example 9 | Math Example--Linear Function Concepts--Linear Functions in Tabular and Graph Form: Example 9TopicLinear Functions DescriptionThis example illustrates the process of creating a table of x-y coordinates and graphing the linear function y = x. The image presents both a graph and a table for this function. The table includes coordinate pairs (0, 0), (1, 1), (2, 2), (3, 3), and (4, 4), showing how the y-value increases by 1 for each unit increase in x. |
Graphs of Linear Functions |
|
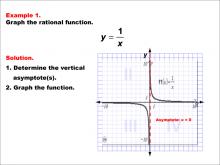
Math Example--Rational Concepts--Graphs of Rational Functions: Example 1 | Math Example--Rational Concepts--Graphs of Rational Functions: Example 1TopicRational Functions DescriptionThis example demonstrates the graph of the rational function y = 1 / x. The graph is a hyperbola with vertical and horizontal asymptotes, with the vertical asymptote occurring at x = 0. Students are tasked with graphing the function and determining its vertical asymptote. |
Rational Functions and Equations |