These are the resources that support this Florida Standard.
MA.912.DP.5.2 - Explain how random sampling produces data that is representative of a population.
Displaying 1 - 31 of 31 resources:
| Thumbnail Image | Title | Description | Curriculum Nodes |
|---|---|---|---|
|
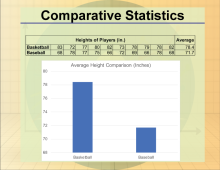
Math Clip Art Collection: Statistics |
This collection aggregates all the math clip art around the topic of Statistics. There are a total of 55 images. | Data Analysis, Probability, Data Gathering and Counting |
|
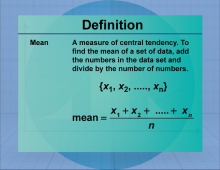
Math Definitions Collection: Measures of Central Tendency |
This collection aggregates all the definition image cards around the topic of Measures of Central Tendency terms and vocabulary. There are a total of 31 terms. | Data Analysis |

|
Math Examples Collection: Mean of a Probability Distribution |
This collection aggregates all the math examples around the topic of Mean of a Probability Distribution. There are a total of 7 images. | Data Analysis |

|
Math Examples Collection: Sample Mean |
This collection aggregates all the math examples around the topic of Sample Mean. There are a total of 7 images. | Data Analysis |
|
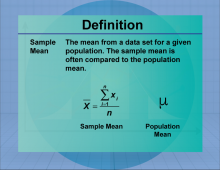
Definition--Measures of Central Tendency--Sample Mean |
Definition--Measures of Central Tendency--Sample Mean
This is a collection of definitions related to measures of central tendency and related concepts. |
Data Analysis |
|
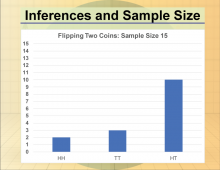
Math Clip Art--Statistics and Probability-- Inferences and Sample Size--10 |
Math Clip Art--Statistics and Probability-- Inferences and Sample Size--10
This is part of a collection of math clip art images that show different statistical graphs and concepts, along with some probability |
Data Gathering |
|
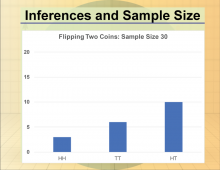
Math Clip Art--Statistics and Probability-- Inferences and Sample Size--11 |
Math Clip Art--Statistics and Probability-- Inferences and Sample Size--11
This is part of a collection of math clip art images that show different statistical graphs and concepts, along with some probability |
Data Gathering |
|
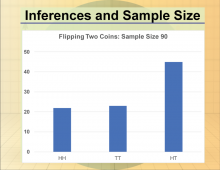
Math Clip Art--Statistics and Probability-- Inferences and Sample Size--12 |
Math Clip Art--Statistics and Probability-- Inferences and Sample Size--12
This is part of a collection of math clip art images that show different statistical graphs and concepts, along with some probability |
Data Gathering |
|
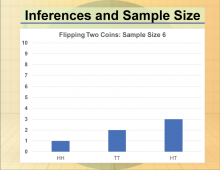
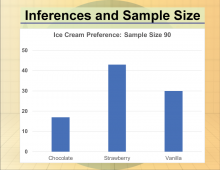
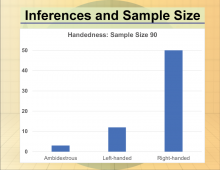
Math Clip Art--Statistics and Probability-- Inferences and Sample Size--9 |
Math Clip Art--Statistics and Probability-- Inferences and Sample Size--9
This is part of a collection of math clip art images that show different statistical graphs and concepts, along with some probability |
Data Gathering |
|
Math Clip Art--Statistics--Inferences and Sample Size--01 |
Math Clip Art--Statistics--Inferences and Sample Size--01
This is part of a collection of math clip art images that show different statistical graphs and concepts, along with some probability concepts. |
Data Gathering |
|
Math Clip Art--Statistics--Inferences and Sample Size--02 |
Math Clip Art--Statistics--Inferences and Sample Size--02
This is part of a collection of math clip art images that show different statistical graphs and concepts, along with some probability concepts. |
Data Gathering |
|
Math Clip Art--Statistics--Inferences and Sample Size--03 |
Math Clip Art--Statistics--Inferences and Sample Size--03
This is part of a collection of math clip art images that show different statistical graphs and concepts, along with some probability concepts. |
Data Gathering |
|
Math Clip Art--Statistics--Inferences and Sample Size--04 |
Math Clip Art--Statistics--Inferences and Sample Size--04
This is part of a collection of math clip art images that show different statistical graphs and concepts, along with some probability concepts. |
Data Gathering |
|
Math Clip Art--Statistics--Inferences and Sample Size--05 |
Math Clip Art--Statistics--Inferences and Sample Size--05
This is part of a collection of math clip art images that show different statistical graphs and concepts, along with some probability concepts. |
Data Gathering |
|
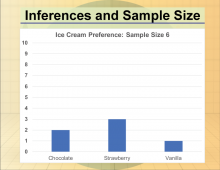
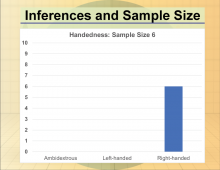
Math Clip Art--Statistics--Inferences and Sample Size--06 |
Math Clip Art--Statistics--Inferences and Sample Size--06
This is part of a collection of math clip art images that show different statistical graphs and concepts, along with some probability concepts. |
Data Gathering |
|
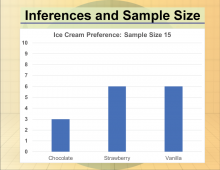
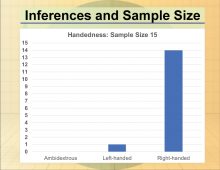
Math Clip Art--Statistics--Inferences and Sample Size--07 |
Math Clip Art--Statistics--Inferences and Sample Size--07
This is part of a collection of math clip art images that show different statistical graphs and concepts, along with some probability concepts. |
Data Gathering |
|
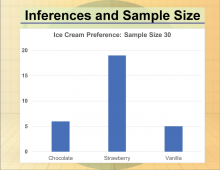
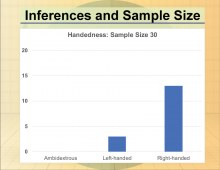
Math Clip Art--Statistics--Inferences and Sample Size--08 |
Math Clip Art--Statistics--Inferences and Sample Size--08
This is part of a collection of math clip art images that show different statistical graphs and concepts, along with some probability concepts. |
Data Gathering |
|
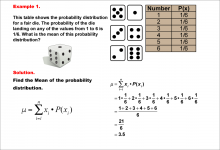
Math Example--Measures of Central Tendency--Mean of a Probability Distribution--Example 1 |
Math Example--Measures of Central Tendency--Mean of a Probability Distribution--Example 1
This is part of a collection of math examples that focus on calculating measures of central tendency: mean, median, mo |
Data Analysis |

|
Math Example--Measures of Central Tendency--Mean of a Probability Distribution--Example 2 |
Math Example--Measures of Central Tendency--Mean of a Probability Distribution--Example 2
This is part of a collection of math examples that focus on calculating measures of central tendency: mean, median, mo |
Data Analysis |

|
Math Example--Measures of Central Tendency--Mean of a Probability Distribution--Example 3 |
Math Example--Measures of Central Tendency--Mean of a Probability Distribution--Example 3
This is part of a collection of math examples that focus on calculating measures of central tendency: mean, median, mo |
Data Analysis |
|
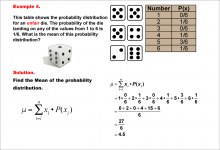
Math Example--Measures of Central Tendency--Mean of a Probability Distribution--Example 4 |
Math Example--Measures of Central Tendency--Mean of a Probability Distribution--Example 4
This is part of a collection of math examples that focus on calculating measures of central tendency: mean, median, mo |
Data Analysis |
|
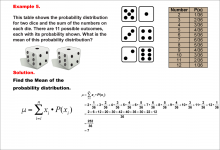
Math Example--Measures of Central Tendency--Mean of a Probability Distribution--Example 5 |
Math Example--Measures of Central Tendency--Mean of a Probability Distribution--Example 5
This is part of a collection of math examples that focus on calculating measures of central tendency: mean, median, mo |
Data Analysis |
|
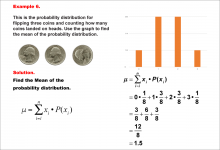
Math Example--Measures of Central Tendency--Mean of a Probability Distribution--Example 6 |
Math Example--Measures of Central Tendency--Mean of a Probability Distribution--Example 6
This is part of a collection of math examples that focus on calculating measures of central tendency: mean, median, mo |
Data Analysis |
|
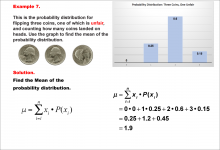
Math Example--Measures of Central Tendency--Mean of a Probability Distribution--Example 7 |
Math Example--Measures of Central Tendency--Mean of a Probability Distribution--Example 7
This is part of a collection of math examples that focus on calculating measures of central tendency: mean, median, mo |
Data Analysis |

|
Math Example--Measures of Central Tendency--Sample Mean--Example 1 |
Math Example--Measures of Central Tendency--Sample Mean--Example 1
This is part of a collection of math examples that focus on calculating measures of central tendency: mean, median, mode, and range. |
Data Analysis |
|
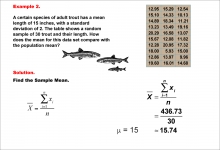
Math Example--Measures of Central Tendency--Sample Mean--Example 2 |
Math Example--Measures of Central Tendency--Sample Mean--Example 2
This is part of a collection of math examples that focus on calculating measures of central tendency: mean, median, mode, and range. |
Data Analysis |
|
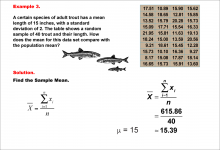
Math Example--Measures of Central Tendency--Sample Mean--Example 3 |
Math Example--Measures of Central Tendency--Sample Mean--Example 3
This is part of a collection of math examples that focus on calculating measures of central tendency: mean, median, mode, and range. |
Data Analysis |

|
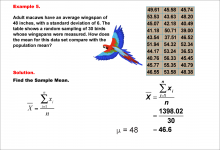
Math Example--Measures of Central Tendency--Sample Mean--Example 4 |
Math Example--Measures of Central Tendency--Sample Mean--Example 4
This is part of a collection of math examples that focus on calculating measures of central tendency: mean, median, mode, and range. |
Data Analysis |
|
Math Example--Measures of Central Tendency--Sample Mean--Example 5 |
Math Example--Measures of Central Tendency--Sample Mean--Example 5
This is part of a collection of math examples that focus on calculating measures of central tendency: mean, median, mode, and range. |
Data Analysis |
|
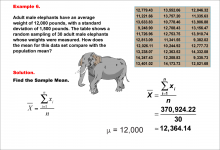
Math Example--Measures of Central Tendency--Sample Mean--Example 6 |
Math Example--Measures of Central Tendency--Sample Mean--Example 6
This is part of a collection of math examples that focus on calculating measures of central tendency: mean, median, mode, and range. |
Data Analysis |
|
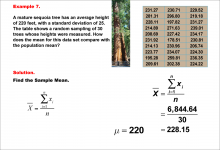
Math Example--Measures of Central Tendency--Sample Mean--Example 7 |
Math Example--Measures of Central Tendency--Sample Mean--Example 7
This is part of a collection of math examples that focus on calculating measures of central tendency: mean, median, mode, and range. |
Data Analysis |