|
|
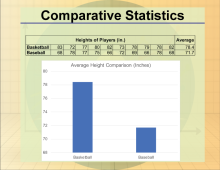
This collection aggregates all the math clip art around the topic of Statistics. There are a total of 55 images. |
Data Analysis,
Probability,
Data Gathering
and Counting
|
|
|
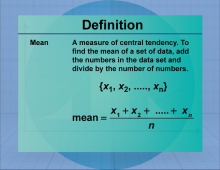
This collection aggregates all the definition image cards around the topic of Measures of Central Tendency terms and vocabulary. There are a total of 31 terms. |
Data Analysis
|
|
|
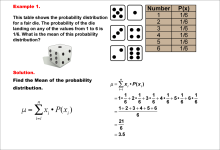
This collection aggregates all the math examples around the topic of Mean of a Probability Distribution. There are a total of 7 images. |
Data Analysis
|
|
|
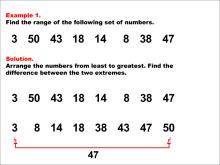
This collection aggregates all the math examples around the topic of Range. There are a total of 26 Math Examples. |
Data Analysis
|
|
|
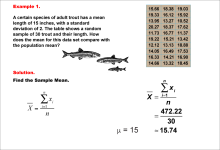
This collection aggregates all the math examples around the topic of Sample Mean. There are a total of 7 images. |
Data Analysis
|
|
|
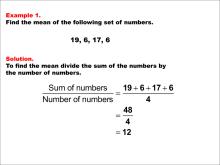
This collection aggregates all the math examples around the topic of the Mean. There are a total of 42 Math Examples. |
Data Analysis
|
|
|
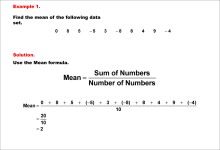
This collection aggregates all the math examples around the topic of the Mean of Data Sets with Negative Numbers. There are a total of 10 images. |
Data Analysis
|
|
|
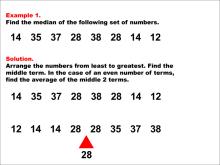
This collection aggregates all the math examples around the topic of the Median. There are a total of 40 Math Examples. |
Data Analysis
|
|
|
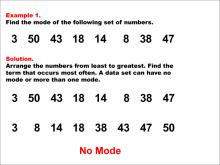
This collection aggregates all the math examples around the topic of the Mode. There are a total of 78 Math Examples. |
Data Analysis
|
|
|
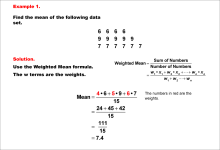
This collection aggregates all the math examples around the topic of Weighted Mean. There are a total of 9 images. |
Data Analysis
|
|
|
This collection aggregates all the math videos and resources in this series: Texas Instruments Tutorial Videos. There are a total of 266 resources. |
Rational Expressions,
Sequences,
Series,
Polynomial Functions and Equations,
Graphs of Quadratic Functions,
Quadratic Equations and Functions,
Solving Systems of Equations,
Trig Expressions and Identities,
Probability,
Geometric Constructions with Triangles,
Composite Functions,
Geometric Constructions with Angles and Planes,
Distance Formula,
Data Analysis,
Slope,
Special Functions,
Trigonometric Functions,
Graphs of Exponential and Logarithmic Functions,
Radical Functions and Equations,
Rational Functions and Equations,
Slope-Intercept Form,
Coordinate Systems,
Graphs of Linear Functions,
Inequalities,
Matrix Operations
and Midpoint Formula
|
|
|
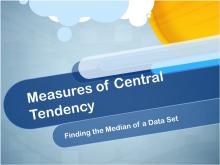
This collection aggregates all the math videos and resources in this series: Video Tutorials Series: Measures of Central Tendency. There are a total of 24 resources. |
Data Analysis
and Data Gathering
|
|
|
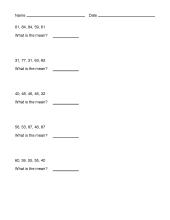
This collection aggregates all the math worksheets around the topic of Data Analysis: Mean, Median, and Mode. There are a total of 60 worksheets. Math Worksheet Collection: Data Analysis: Mean, Median, and Mode |
Data Analysis
|

|
|
This is a collection of Quizlet Flash Cards on the topic of Finding the Middle Term. There are a total of 5 Quizlet Flash Card sets. |
Compare and Order Numbers
|

|
|
This is a collection of Quizlet Flash Cards on the topic of Measures of Central Tendency. There are a total of 20 Quizlet Flash Card sets. |
Data Analysis
|
|
|
Closed Captioned Video: A Probability Simulation 2
In this TI Nspire tutorial, the Spreadsheet and Statistics windows are used to create a probability simulation of a coin toss. |
Probability
|
|
|
Closed Captioned Video: A Probability Simulation 3
In this TI Nspire tutorial, the Spreadsheet and Statistics windows are used to create a probability simulation of tossing two coins. |
Probability
|
|
|
Closed Captioned Video: Probability Simulation 1
In this TI Nspire tutorialthe Spreadsheet and Statistics windows are used to create a probability simulation of tossing two dice. |
Probability
|
|
|
Closed Captioned Video: Random Number Table
In this TI Nspire tutorial, the Spreadsheet window is used to create a random number table. This video supports the TI-Nspire Clickpad and Touchpad. |
Probability
|
|
|
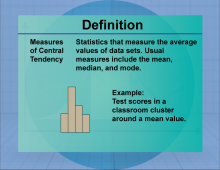
Measures of Central Tendency |
Data Analysis
|
|
|
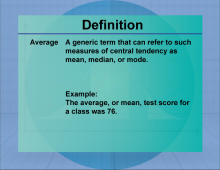
Average |
Data Analysis
|
|
|
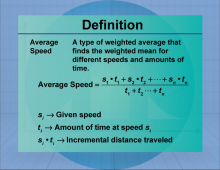
Average Speed |
Data Analysis
|
|
|
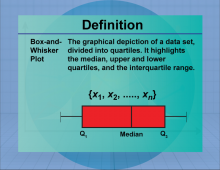
Box-and-Whisker Plot |
Data Analysis
|
|
|
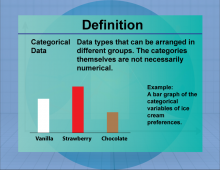
Categorical Data |
Data Analysis
|
|
|
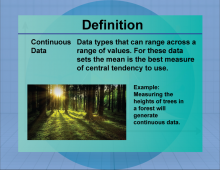
Continuous Data |
Data Analysis
|
|
|
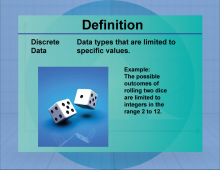
Discrete Data |
Data Analysis
|
|
|
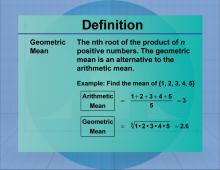
Geometric Mean |
Data Analysis
|
|
|
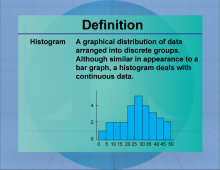
Histogram |
Data Analysis
|
|
|
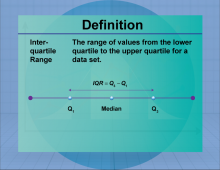
Interquartile Range |
Data Analysis
|
|
|
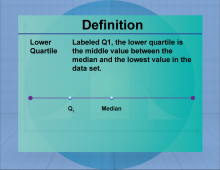
Lower Quartile |
Data Analysis
|
|
|
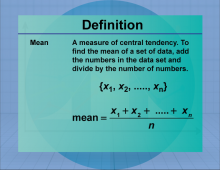
Mean |
Data Analysis
|
|
|
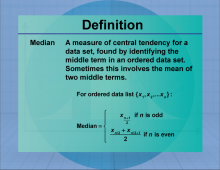
Median |
Data Analysis
|
|
|
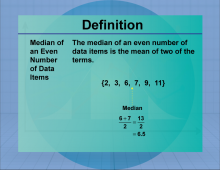
Median of an Even Data Set |
Data Analysis
|
|
|
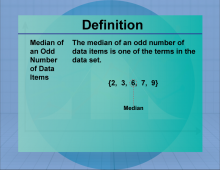
Median of an Odd Data Set |
Data Analysis
|
|
|
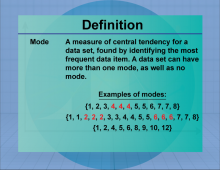
Mode |
Data Analysis
|
|
|
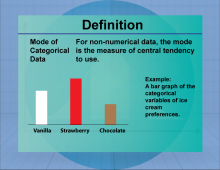
Mode of Categorical Data |
Data Analysis
|
|
|
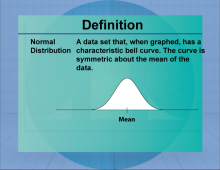
Normal Distribution |
Data Analysis
|
|
|
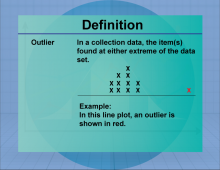
Outlier |
Data Analysis
|
|
|
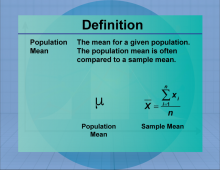
Population Mean |
Data Analysis
|
|
|
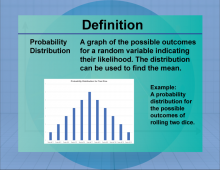
Probability Distribution |
Data Analysis
|
|
|
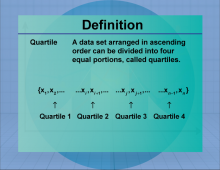
Quartile |
Data Analysis
|
|
|
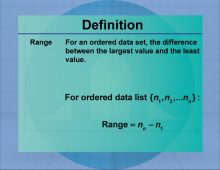
Range |
Data Analysis
|
|
|
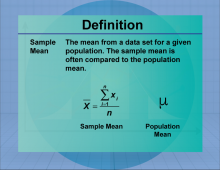
Sample Mean |
Data Analysis
|
|
|
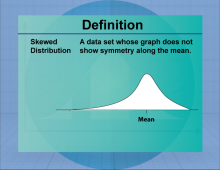
Skewed Distribution |
Data Analysis
|
|
|
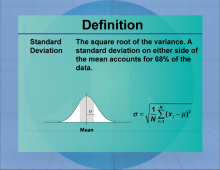
Standard Deviation |
Data Analysis
|
|
|
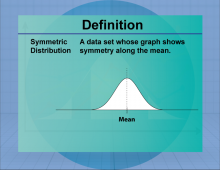
Symmetric Distribution |
Data Analysis
|
|
|
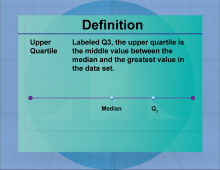
Upper Quartile |
Data Analysis
|
|
|
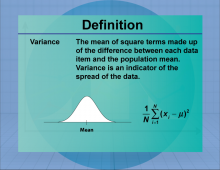
Variance |
Data Analysis
|
|
|
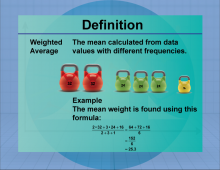
Weighted Average |
Data Analysis
|
|
|
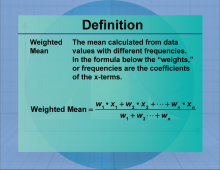
Weighted Mean |
Data Analysis
|