
Illustrative Math Alignment: Grade 8 Unit 3
Functions and Volume
Lesson 3: Equations for Functions
Use the following Media4Math resources with this Illustrative Math lesson.
| Thumbnail Image | Title | Body | Curriculum Topic |
|---|---|---|---|

|
Interactive Word Search Puzzle--Linear Functions, Puzzle 4 | Interactive Word Search Puzzle--Linear Functions, Puzzle 4
Solve an interactive word search puzzle on the topic of Linear Equations and Functions. This is part of a collection of math games and interactives. To see the complete collection of the games, click on this link. Note: The download is the teacher's guide.Related ResourcesTo see additional resources on this topic, click on the Related Resources tab. |
Applications of Linear Functions |

|
Interactive Word Search Puzzle--Linear Functions, Puzzle 5 | Interactive Word Search Puzzle--Linear Functions, Puzzle 5
Solve an interactive word search puzzle on the topic of Linear Equations and Functions. This is part of a collection of math games and interactives. To see the complete collection of the games, click on this link. Note: The download is the teacher's guide.Related ResourcesTo see additional resources on this topic, click on the Related Resources tab. |
Applications of Linear Functions |

|
Lesson Plan--Linear Functions and Equations (MS)--Lesson 5--Linear Functions and Applications | Lesson Plan: Linear Functions and ApplicationsThis is the fifth and final lesson in a five-part series on linear equations and inequalities designed for middle school students. In this lesson, students explore linear functions in-depth, learning how to represent them using equations, tables, and graphs. They will analyze key function properties, including slope, y-intercept, domain, and range, to develop a complete understanding of how linear functions behave. The lesson focuses on real-world applications, demonstrating how linear functions are used in various fields such as finance, physics, and business. Students will solve problems involving rates of change, cost analysis, and motion, reinforcing the practical significance of linear functions. Through guided practice and hands-on activities, they will interpret linear relationships and predict outcomes using function models. |
Applications of Linear Functions |

|
Lesson Plan--Ratios, Proportions, and Percents (Gr 8)--Lesson 4--Understanding Direct Variation and Its Connection to Proportional Relationships | Lesson Plan: Direct Variations In this lesson, students will explore direct variation, a special type of proportional relationship where one variable is a constant multiple of another. They will learn how to identify direct variation in tables, graphs, and equations, determine the constant of variation (k), and understand how direct variation relates to linear functions. Key concepts covered in this lesson include: |
Applications of Linear Functions and Applications of Ratios, Proportions, and Percents |

|
Lesson Plan--Ratios, Proportions, and Percents (Gr 8)--Lesson 5--Analyzing and Comparing Linear Relationships, Including Parallel and Perpendicular Lines | Lesson Plan: Parallel and Perpendicular Lines In this lesson, students explore the properties of parallel and perpendicular lines in coordinate geometry. They will learn how to identify these lines based on their slopes, determine equations for parallel and perpendicular lines, and apply these concepts to solve real-world and mathematical problems. Key concepts covered in this lesson include: |
Graphs of Linear Functions |

|
Lesson Plan--Slope Concepts--Lesson 3--Visualizing Slope | Lesson Plan: Visualizing Slope on a Graph This lesson is the third installment in Media4Math's comprehensive six-part series on understanding slope in mathematics. It focuses on helping students visualize and comprehend slope by engaging in hands-on activities that involve plotting points on a coordinate plane and analyzing the resulting lines. |
Slope |

|
Lesson Plan--Slope Concepts--Lesson 6--Slope as Rate of Change | Lesson Plan: Slope as Rate of Change This lesson is the sixth and final installment in Media4Math's comprehensive six-part series on understanding slope in mathematics. It focuses on interpreting slope as a rate of change between two quantities, enabling students to apply this concept to real-world scenarios and mathematical problems. |
Slope |
|
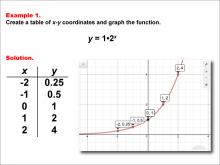
Math Example--Exponential Concepts--Exponential Functions in Tabular and Graph Form: Example 1 | Math Example--Exponential Concepts--Exponential Functions in Tabular and Graph Form: Example 1TopicExponential Functions DescriptionThis example demonstrates how to create a table of x-y coordinates and graph the exponential function y = 1 * 2x. The table lists coordinates for x values from -2 to 2, showing how the y values grow exponentially. The corresponding graph visually represents this rapid growth, with points plotted at (-2, 0.25), (-1, 0.5), (0, 1), (1, 2), and (2, 4). |
Graphs of Exponential and Logarithmic Functions |
|
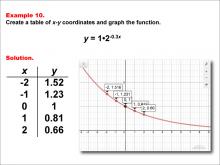
Math Example--Exponential Concepts--Exponential Functions in Tabular and Graph Form: Example 10 | Math Example--Exponential Concepts--Exponential Functions in Tabular and Graph Form: Example 10TopicExponential Functions DescriptionThis example demonstrates the creation of a table of x-y coordinates and the graphing of the exponential function y = 1 * 2-0.3x. The image provides both a table of values and a graph plotted on a coordinate plane, with points labeled for x values ranging from -2 to 2. This representation helps students visualize the behavior of a decreasing exponential function with a fractional exponent. |
Graphs of Exponential and Logarithmic Functions |
|
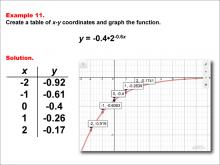
Math Example--Exponential Concepts--Exponential Functions in Tabular and Graph Form: Example 11 | Math Example--Exponential Concepts--Exponential Functions in Tabular and Graph Form: Example 11TopicExponential Functions DescriptionThis example illustrates the process of creating a table of x-y coordinates and graphing the exponential function y = -0.4 * 2-0.6x. The image presents both a table of values and a graph plotted on a coordinate plane, with points labeled for x values from -2 to 2. This representation helps students visualize the behavior of a decreasing exponential function with a negative coefficient and a fractional exponent. |
Graphs of Exponential and Logarithmic Functions |
|
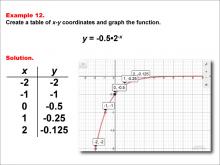
Math Example--Exponential Concepts--Exponential Functions in Tabular and Graph Form: Example 12 | Math Example--Exponential Concepts--Exponential Functions in Tabular and Graph Form: Example 12TopicExponential Functions DescriptionThis example demonstrates the creation of a table of x-y coordinates and the graphing of the exponential function y = -0.5 * 2-x. The image provides both a table of values and a graph plotted on a coordinate plane, with points labeled for x values ranging from -2 to 2. This representation helps students visualize the behavior of a decreasing exponential function with a negative coefficient and a negative exponent. |
Graphs of Exponential and Logarithmic Functions |
|
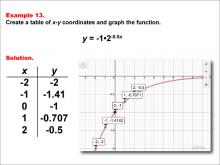
Math Example--Exponential Concepts--Exponential Functions in Tabular and Graph Form: Example 13 | Math Example--Exponential Concepts--Exponential Functions in Tabular and Graph Form: Example 13TopicExponential Functions DescriptionThis example illustrates the process of creating a table of x-y coordinates and graphing the exponential function y = -1 * 2-0.5x. The image presents both a table of values and a graph plotted on a coordinate plane, with points labeled for x values from -2 to 2. This representation helps students visualize the behavior of an increasing exponential function with a negative coefficient and a fractional negative exponent. |
Graphs of Exponential and Logarithmic Functions |
|
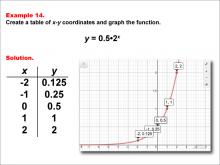
Math Example--Exponential Concepts--Exponential Functions in Tabular and Graph Form: Example 14 | Math Example--Exponential Concepts--Exponential Functions in Tabular and Graph Form: Example 14TopicExponential Functions DescriptionThis example demonstrates the creation of a table of x-y coordinates and the graphing of the exponential function y = 0.5 * 2x. The image provides both a table of values and a graph plotted on a coordinate plane, with points labeled for x values ranging from -2 to 2. This representation helps students visualize the behavior of an increasing exponential function with a fractional coefficient. |
Graphs of Exponential and Logarithmic Functions |
|
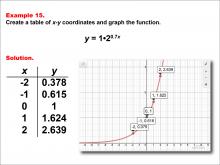
Math Example--Exponential Concepts--Exponential Functions in Tabular and Graph Form: Example 15 | Math Example--Exponential Concepts--Exponential Functions in Tabular and Graph Form: Example 15TopicExponential Functions DescriptionThis example illustrates the process of creating a table of x-y coordinates and graphing the exponential function y = 1 * 20.7x. The image presents both a table of values and a graph plotted on a coordinate plane, with points labeled for x values from -2 to 2. This representation helps students visualize the behavior of an increasing exponential function with a fractional positive exponent. |
Graphs of Exponential and Logarithmic Functions |
|
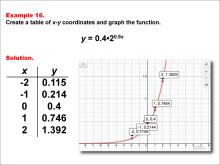
Math Example--Exponential Concepts--Exponential Functions in Tabular and Graph Form: Example 16 | Math Example--Exponential Concepts--Exponential Functions in Tabular and Graph Form: Example 16TopicExponential Functions DescriptionThis example demonstrates the creation of a table of x-y coordinates and the graphing of the exponential function y = 0.4 * 20.9x. The image provides both a table of values and a graph plotted on a Cartesian plane, with points labeled for x values ranging from -2 to 2. This representation helps students visualize the behavior of an increasing exponential function with a fractional coefficient and a fractional exponent. |
Graphs of Exponential and Logarithmic Functions |
|
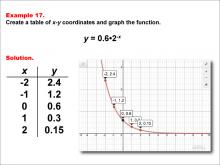
Math Example--Exponential Concepts--Exponential Functions in Tabular and Graph Form: Example 17 | Math Example--Exponential Concepts--Exponential Functions in Tabular and Graph Form: Example 17TopicExponential Functions DescriptionThis example illustrates the process of creating a table of x-y coordinates and graphing the exponential function y = 0.6 * 2-x. The image presents both a table of values and a graph plotted on a coordinate plane, with points labeled for x values from -2 to 2. This representation helps students visualize the behavior of a decreasing exponential function with a fractional coefficient and a negative exponent. |
Graphs of Exponential and Logarithmic Functions |
|
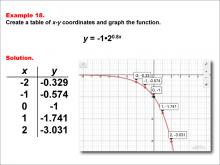
Math Example--Exponential Concepts--Exponential Functions in Tabular and Graph Form: Example 18 | Math Example--Exponential Concepts--Exponential Functions in Tabular and Graph Form: Example 18TopicExponential Functions DescriptionThis example demonstrates the creation of a table of x-y coordinates and the graphing of the exponential function y = -1 * 20.8x. The image provides both a table of values and a graph plotted on a coordinate plane, with points labeled for x values ranging from -2 to 2. This representation helps students visualize the behavior of a decreasing exponential function with a negative coefficient and a fractional positive exponent. |
Graphs of Exponential and Logarithmic Functions |
|
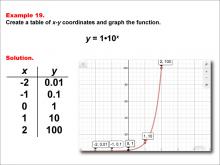
Math Example--Exponential Concepts--Exponential Functions in Tabular and Graph Form: Example 19 | Math Example--Exponential Concepts--Exponential Functions in Tabular and Graph Form: Example 19TopicExponential Functions DescriptionThis example illustrates the process of creating a table of x-y coordinates and graphing the exponential function y = 1 * 10x. The image presents both a table of values and a graph plotted on a coordinate plane, with points labeled for x values from -2 to 2. This representation helps students visualize the behavior of an increasing exponential function with a base of 10. |
Graphs of Exponential and Logarithmic Functions |
|
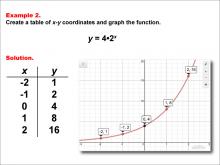
Math Example--Exponential Concepts--Exponential Functions in Tabular and Graph Form: Example 2 | Math Example--Exponential Concepts--Exponential Functions in Tabular and Graph Form: Example 2TopicExponential Functions DescriptionThis example presents the exponential function y = 4 * 2x through a table of x-y coordinates and its corresponding graph. The table shows five key points: (-2, 1), (-1, 2), (0, 4), (1, 8), and (2, 16). These points are then plotted on a graph, demonstrating how the function grows exponentially as x increases. |
Graphs of Exponential and Logarithmic Functions |
|
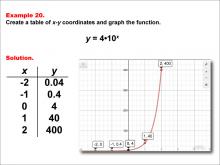
Math Example--Exponential Concepts--Exponential Functions in Tabular and Graph Form: Example 20 | Math Example--Exponential Concepts--Exponential Functions in Tabular and Graph Form: Example 20TopicExponential Functions DescriptionThis example demonstrates the creation of a table of x-y coordinates and the graphing of the exponential function y = 4 * 10x. The image provides both a table of values and a graph plotted on a coordinate plane, with points labeled for x values ranging from -2 to 2. This representation helps students visualize the behavior of an increasing exponential function with a coefficient greater than 1 and a base of 10. |
Graphs of Exponential and Logarithmic Functions |
|
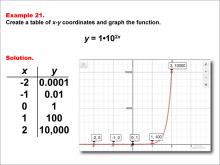
Math Example--Exponential Concepts--Exponential Functions in Tabular and Graph Form: Example 21 | Math Example--Exponential Concepts--Exponential Functions in Tabular and Graph Form: Example 21TopicExponential Functions DescriptionThis math example focuses on creating a table of x-y coordinates and graphing the exponential function y = 1 * 102x. The image displays both a graph and a corresponding table, illustrating the rapid growth of this function. The table includes key points such as (-2, 0.0001), (-1, 0.01), (0, 1), (1, 100), and (2, 10,000), demonstrating how quickly the y-values increase as x increases. |
Graphs of Exponential and Logarithmic Functions |
|
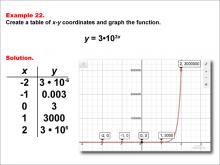
Math Example--Exponential Concepts--Exponential Functions in Tabular and Graph Form: Example 22 | Math Example--Exponential Concepts--Exponential Functions in Tabular and Graph Form: Example 22TopicExponential Functions DescriptionThis math example demonstrates the creation of a table of x-y coordinates and the graphing of the exponential function y = 3 * 103x. The image showcases both a graph and a corresponding table, highlighting the extremely rapid growth of this function. The table includes key points such as (-2, 3 * 10-6), (-1, 0.003), (0, 3), (1, 3000), and (2, 3 * 106), illustrating the dramatic increase in y-values as x increases. |
Graphs of Exponential and Logarithmic Functions |
|
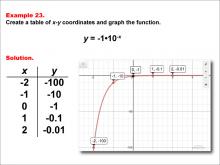
Math Example--Exponential Concepts--Exponential Functions in Tabular and Graph Form: Example 23 | Math Example--Exponential Concepts--Exponential Functions in Tabular and Graph Form: Example 23TopicExponential Functions DescriptionThis math example focuses on creating a table of x-y coordinates and graphing the exponential function y = -1 * 10-x. The image displays both a graph and a corresponding table, illustrating the behavior of this negative exponential function. The table includes key points such as (-2, -100), (-1, -10), (0, -1), (1, -0.1), and (2, -0.01), demonstrating how the y-values approach zero as x increases. |
Graphs of Exponential and Logarithmic Functions |
|
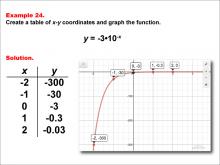
Math Example--Exponential Concepts--Exponential Functions in Tabular and Graph Form: Example 24 | Math Example--Exponential Concepts--Exponential Functions in Tabular and Graph Form: Example 24TopicExponential Functions DescriptionThis math example demonstrates the creation of a table of x-y coordinates and the graphing of the exponential function y = -3 * 10-x. The image showcases both a graph and a corresponding table, highlighting the behavior of this negative exponential function with a coefficient. The table includes key points such as (-2, -300), (-1, -30), (0, -3), (1, -0.3), and (2, -0.03), illustrating how the y-values approach zero from the negative side as x increases. |
Graphs of Exponential and Logarithmic Functions |
|
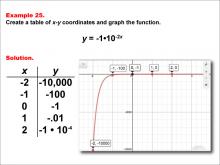
Math Example--Exponential Concepts--Exponential Functions in Tabular and Graph Form: Example 25 | Math Example--Exponential Concepts--Exponential Functions in Tabular and Graph Form: Example 25TopicExponential Functions DescriptionThis math example focuses on creating a table of x-y coordinates and graphing the exponential function y = -1 * 10-2x. The image displays both a graph and a corresponding table, illustrating the behavior of this negative exponential function with a doubled exponent. The table includes key points such as (-2, -10000), (-1, -100), (0, -1), (1, -0.01), and (2, -1 * 10-4), demonstrating how rapidly the y-values approach zero from the negative side as x increases. |
Graphs of Exponential and Logarithmic Functions |
|
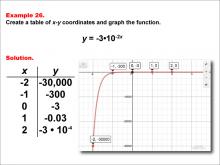
Math Example--Exponential Concepts--Exponential Functions in Tabular and Graph Form: Example 26 | Math Example--Exponential Concepts--Exponential Functions in Tabular and Graph Form: Example 26TopicExponential Functions DescriptionThis math example demonstrates the creation of a table of x-y coordinates and the graphing of the exponential function y = -3 * 10-2x. The image showcases both a graph and a corresponding table, highlighting the behavior of this negative exponential function with a coefficient and a doubled exponent. The table includes key points such as (-2, -30000), (-1, -300), (0, -3), (1, -0.03), and (2, -3 * 10-4), illustrating how rapidly the y-values approach zero from the negative side as x increases. |
Graphs of Exponential and Logarithmic Functions |
|
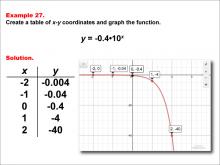
Math Example--Exponential Concepts--Exponential Functions in Tabular and Graph Form: Example 27 | Math Example--Exponential Concepts--Exponential Functions in Tabular and Graph Form: Example 27TopicExponential Functions DescriptionThis math example focuses on creating a table of x-y coordinates and graphing the exponential function y = -0.4 * 10x. The image displays both a graph and a corresponding table, illustrating the behavior of this negative exponential function with a fractional coefficient. The table includes key points such as (-2, -0.004), (-1, -0.04), (0, -0.4), (1, -4), and (2, -40), demonstrating how the y-values decrease rapidly in the negative direction as x increases. |
Graphs of Exponential and Logarithmic Functions |
|
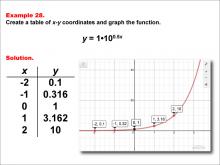
Math Example--Exponential Concepts--Exponential Functions in Tabular and Graph Form: Example 28 | Math Example--Exponential Concepts--Exponential Functions in Tabular and Graph Form: Example 28TopicExponential Functions DescriptionThis math example demonstrates the creation of a table of x-y coordinates and the graphing of the exponential function y = 1 * 100.5x. The image showcases both a graph and a corresponding table, highlighting the behavior of this exponential function with a fractional exponent. The table includes key points such as (-2, 0.1), (-1, 0.316), (0, 1), (1, 3.162), and (2, 10), illustrating how the y-values increase at a slower rate compared to a standard exponential function. |
Graphs of Exponential and Logarithmic Functions |
|
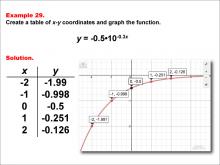
Math Example--Exponential Concepts--Exponential Functions in Tabular and Graph Form: Example 29 | Math Example--Exponential Concepts--Exponential Functions in Tabular and Graph Form: Example 29TopicExponential Functions DescriptionThis math example focuses on creating a table of x-y coordinates and graphing the exponential function y = -0.5 * 10-0.3x. The image displays both a graph and a corresponding table, illustrating the behavior of this negative exponential function with a fractional coefficient and a negative fractional exponent. The table includes key points such as (-2, -1.99), (-1, -0.998), (0, -0.5), (1, -0.251), and (2, -0.126), demonstrating how the y-values approach zero from the negative side as x increases. |
Graphs of Exponential and Logarithmic Functions |
|
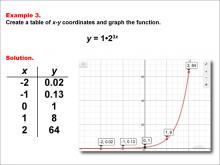
Math Example--Exponential Concepts--Exponential Functions in Tabular and Graph Form: Example 3 | Math Example--Exponential Concepts--Exponential Functions in Tabular and Graph Form: Example 3TopicExponential Functions DescriptionThis example showcases the exponential function y = 1 * 23x through a table of x-y coordinates and its corresponding graph. The table presents five key points: (-2, 0.02), (-1, 0.13), (0, 1), (1, 8), and (2, 64). These points are then plotted on a graph, illustrating the rapid growth of this function as x increases. |
Graphs of Exponential and Logarithmic Functions |
|
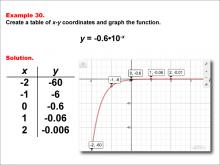
Math Example--Exponential Concepts--Exponential Functions in Tabular and Graph Form: Example 30 | Math Example--Exponential Concepts--Exponential Functions in Tabular and Graph Form: Example 30TopicExponential Functions DescriptionThis math example demonstrates the creation of a table of x-y coordinates and the graphing of the exponential function y = -0.6 * 10-x. The image showcases both a graph and a corresponding table, highlighting the behavior of this negative exponential function with a fractional coefficient and a negative exponent. The table includes key points such as (-2, -60), (-1, -6), (0, -0.6), (1, -0.06), and (2, -0.006), illustrating how rapidly the y-values approach zero from the negative side as x increases. |
Graphs of Exponential and Logarithmic Functions |
|
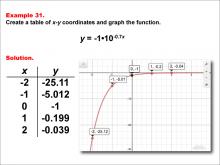
Math Example--Exponential Concepts--Exponential Functions in Tabular and Graph Form: Example 31 | Math Example--Exponential Concepts--Exponential Functions in Tabular and Graph Form: Example 31TopicExponential Functions DescriptionThis math example demonstrates the exponential function y = -1 * 10-0.7x in both tabular and graphical form. The table provides x-y coordinates for x values ranging from -2 to 2, showing how the function's output changes as x increases. The corresponding graph visually represents this relationship, illustrating the characteristic shape of an exponential decay function. |
Graphs of Exponential and Logarithmic Functions |
|
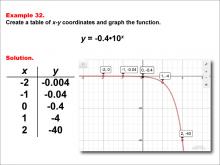
Math Example--Exponential Concepts--Exponential Functions in Tabular and Graph Form: Example 32 | Math Example--Exponential Concepts--Exponential Functions in Tabular and Graph Form: Example 32TopicExponential Functions DescriptionThis math example illustrates the exponential function y = -0.4 * 10x through both a table of values and a graph. The table presents x-y coordinates for x values from -2 to 2, demonstrating how the function's output changes rapidly as x increases. The accompanying graph provides a visual representation of this exponential growth function, highlighting its distinctive shape and behavior. |
Graphs of Exponential and Logarithmic Functions |
|
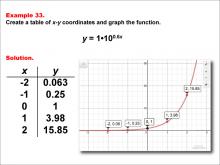
Math Example--Exponential Concepts--Exponential Functions in Tabular and Graph Form: Example 33 | Math Example--Exponential Concepts--Exponential Functions in Tabular and Graph Form: Example 33TopicExponential Functions DescriptionThis math example showcases the exponential function y = 1 * 100.6x through a table of x-y coordinates and a corresponding graph. The table lists values for x ranging from -2 to 2, illustrating how the function's output changes as x increases. The graph provides a visual representation of this exponential growth function, emphasizing its characteristic shape and behavior. |
Graphs of Exponential and Logarithmic Functions |
|
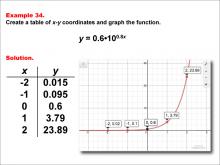
Math Example--Exponential Concepts--Exponential Functions in Tabular and Graph Form: Example 34 | Math Example--Exponential Concepts--Exponential Functions in Tabular and Graph Form: Example 34TopicExponential Functions DescriptionThis math example presents the exponential function y = 0.6 * 100.8x through both a table of x-y coordinates and a graph. The table provides values for x ranging from -2 to 2, demonstrating how the function's output changes as x increases. The accompanying graph offers a visual representation of this exponential growth function, highlighting its distinctive shape and behavior. |
Graphs of Exponential and Logarithmic Functions |
|
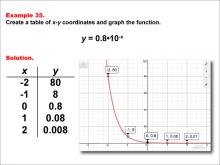
Math Example--Exponential Concepts--Exponential Functions in Tabular and Graph Form: Example 35 | Math Example--Exponential Concepts--Exponential Functions in Tabular and Graph Form: Example 35TopicExponential Functions DescriptionThis math example illustrates the exponential function y = 0.8 * 10-x through a table of x-y coordinates and a corresponding graph. The table lists values for x ranging from -2 to 2, showing how the function's output changes as x increases. The graph provides a visual representation of this exponential decay function, emphasizing its characteristic shape and behavior. |
Graphs of Exponential and Logarithmic Functions |
|
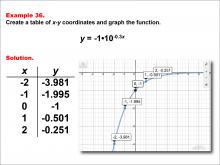
Math Example--Exponential Concepts--Exponential Functions in Tabular and Graph Form: Example 36 | Math Example--Exponential Concepts--Exponential Functions in Tabular and Graph Form: Example 36TopicExponential Functions DescriptionThis math example illustrates the exponential function y = -1 * 10-0.3x through both a table of values and a graph. The table presents x-y coordinates for x values from -2 to 2, demonstrating how the function's output changes as x increases. The accompanying graph provides a visual representation of this exponential decay function with a negative coefficient, highlighting its distinctive shape and behavior. |
Graphs of Exponential and Logarithmic Functions |
|
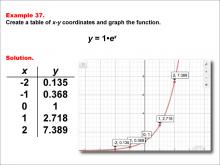
Math Example--Exponential Concepts--Exponential Functions in Tabular and Graph Form: Example 37 | Math Example--Exponential Concepts--Exponential Functions in Tabular and Graph Form: Example 37TopicExponential Functions DescriptionThis math example presents the exponential function y = 1 * ex through both a table of x-y coordinates and a graph. The table provides values for x ranging from -2 to 2, demonstrating how the function's output changes as x increases. The accompanying graph offers a visual representation of this natural exponential function, highlighting its characteristic shape and behavior. |
Graphs of Exponential and Logarithmic Functions |
|
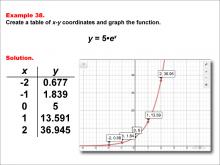
Math Example--Exponential Concepts--Exponential Functions in Tabular and Graph Form: Example 38 | Math Example--Exponential Concepts--Exponential Functions in Tabular and Graph Form: Example 38TopicExponential Functions DescriptionThis math example illustrates the exponential function y = 5 * ex through a table of x-y coordinates and a corresponding graph. The table lists values for x ranging from -2 to 2, showing how the function's output changes as x increases. The graph provides a visual representation of this scaled natural exponential function, emphasizing its characteristic shape and behavior. |
Graphs of Exponential and Logarithmic Functions |
|
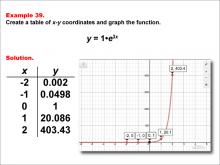
Math Example--Exponential Concepts--Exponential Functions in Tabular and Graph Form: Example 39 | Math Example--Exponential Concepts--Exponential Functions in Tabular and Graph Form: Example 39TopicExponential Functions DescriptionThis math example showcases the exponential function y = 1 * e3x through a table of x-y coordinates and a corresponding graph. The table lists values for x ranging from -2 to 2, illustrating how the function's output changes rapidly as x increases. The graph provides a visual representation of this exponential growth function with a modified exponent, emphasizing its steep growth curve and behavior. |
Graphs of Exponential and Logarithmic Functions |
|
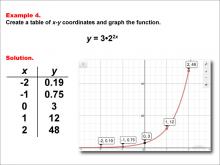
Math Example--Exponential Concepts--Exponential Functions in Tabular and Graph Form: Example 4 | Math Example--Exponential Concepts--Exponential Functions in Tabular and Graph Form: Example 4TopicExponential Functions DescriptionThis example demonstrates how to create a table of x-y coordinates and graph the exponential function y = 3 * 22x. The image provides a visual representation of the function, showing both a table of coordinates and a graph plotted on a coordinate plane. The table lists x-y coordinates for x values ranging from -2 to 2, with corresponding y values calculated using the given function. |
Graphs of Exponential and Logarithmic Functions |
|
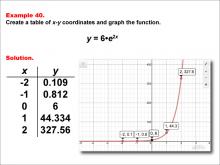
Math Example--Exponential Concepts--Exponential Functions in Tabular and Graph Form: Example 40 | Math Example--Exponential Concepts--Exponential Functions in Tabular and Graph Form: Example 40TopicExponential Functions DescriptionThis math example illustrates the exponential function y = 6 * e2x through both a table of values and a graph. The table presents x-y coordinates for x values from -2 to 2, demonstrating the rapid growth of this function as x increases. The accompanying graph provides a visual representation of this exponential growth function, highlighting its steep curve and behavior. |
Graphs of Exponential and Logarithmic Functions |
|
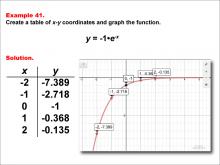
Math Example--Exponential Concepts--Exponential Functions in Tabular and Graph Form: Example 41 | Math Example--Exponential Concepts--Exponential Functions in Tabular and Graph Form: Example 41TopicExponential Functions DescriptionThis math example showcases the exponential function y = -1 * e-x through a table of x-y coordinates and a corresponding graph. The table lists values for x ranging from -2 to 2, illustrating how the function's output changes as x increases. The graph provides a visual representation of this exponential decay function with a negative coefficient, emphasizing its unique shape and behavior. |
Graphs of Exponential and Logarithmic Functions |
|
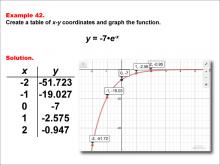
Math Example--Exponential Concepts--Exponential Functions in Tabular and Graph Form: Example 42 | Math Example--Exponential Concepts--Exponential Functions in Tabular and Graph Form: Example 42TopicExponential Functions DescriptionThis math example illustrates the exponential function y = -7 * e-x through both a table of values and a graph. The table presents x-y coordinates for x values from -2 to 2, demonstrating how the function's output changes as x increases. The accompanying graph provides a visual representation of this exponential decay function with a negative coefficient, highlighting its distinctive shape and behavior. |
Graphs of Exponential and Logarithmic Functions |
|
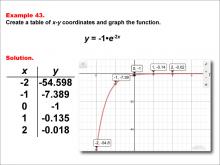
Math Example--Exponential Concepts--Exponential Functions in Tabular and Graph Form: Example 43 | Math Example--Exponential Concepts--Exponential Functions in Tabular and Graph Form: Example 43TopicExponential Functions DescriptionThis math example showcases the exponential function y = -1 * e-2x through a table of x-y coordinates and a corresponding graph. The table lists values for x ranging from -2 to 2, illustrating how the function's output changes rapidly as x increases. The graph provides a visual representation of this exponential growth function with a negative coefficient, emphasizing its unique shape and behavior. |
Graphs of Exponential and Logarithmic Functions |
|
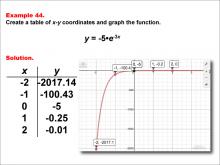
Math Example--Exponential Concepts--Exponential Functions in Tabular and Graph Form: Example 44 | Math Example--Exponential Concepts--Exponential Functions in Tabular and Graph Form: Example 44TopicExponential Functions DescriptionThis math example illustrates the exponential function y = -5 * e-3x through both a table of values and a graph. The table presents x-y coordinates for x values from -2 to 2, demonstrating the extremely rapid change in the function's output as x increases. The accompanying graph provides a visual representation of this exponential growth function with a negative coefficient and tripled exponent, highlighting its steep curve and unique behavior. |
Graphs of Exponential and Logarithmic Functions |
|
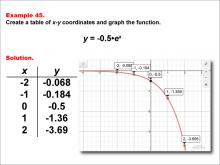
Math Example--Exponential Concepts--Exponential Functions in Tabular and Graph Form: Example 45 | Math Example--Exponential Concepts--Exponential Functions in Tabular and Graph Form: Example 45TopicExponential Functions DescriptionThis example showcases the exponential function y = -0.5 * ex through a graph and table of x-y coordinates. The table provides points (-2, -0.068), (-1, -0.184), (0, -0.5), (1, -1.36), and (2, -3.69), which are plotted on the accompanying graph. Students are tasked with creating this table and graph to visualize the function's behavior. |
Graphs of Exponential and Logarithmic Functions |
|
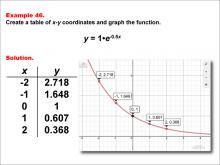
Math Example--Exponential Concepts--Exponential Functions in Tabular and Graph Form: Example 46 | Math Example--Exponential Concepts--Exponential Functions in Tabular and Graph Form: Example 46TopicExponential Functions DescriptionThis example showcases the exponential function y = 1 * e-0.5x through a graph and table of x-y coordinates. The table provides points (-2, 2.718), (-1, 1.648), (0, 1), (1, 0.607), and (2, 0.368), which are plotted on the accompanying graph. Students are tasked with creating this table and graph to visualize the function's behavior. |
Graphs of Exponential and Logarithmic Functions |
|
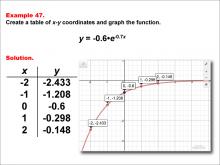
Math Example--Exponential Concepts--Exponential Functions in Tabular and Graph Form: Example 47 | Math Example--Exponential Concepts--Exponential Functions in Tabular and Graph Form: Example 47TopicExponential Functions DescriptionThis example illustrates the exponential function y = -0.6 * e-0.7x through a graph and table of x-y coordinates. The table provides points (-2, -2.433), (-1, -1.208), (0, -0.6), (1, -0.298), and (2, -0.148), which are plotted on the accompanying graph. Students are challenged to create this table and graph to visualize the function's behavior. |
Graphs of Exponential and Logarithmic Functions |
|
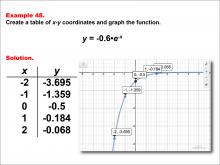
Math Example--Exponential Concepts--Exponential Functions in Tabular and Graph Form: Example 48 | Math Example--Exponential Concepts--Exponential Functions in Tabular and Graph Form: Example 48TopicExponential Functions DescriptionThis example presents the exponential function y = -0.5 * e-x through a graph and table of x-y coordinates. The table provides points (-2, -3.695), (-1, -1.359), (0, -0.5), (1, -0.184), and (2, -0.068), which are plotted on the accompanying graph. Students are tasked with creating this table and graph to visualize the function's behavior. |
Graphs of Exponential and Logarithmic Functions |