
Illustrative Math Alignment: Grade 8 Unit 3
Functions and Volume
Lesson 20: The Volume of a Sphere
Use the following Media4Math resources with this Illustrative Math lesson.
| Thumbnail Image | Title | Body | Curriculum Topic |
|---|---|---|---|
|
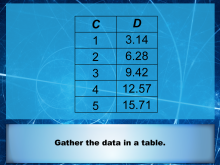
Math Clip Art--Applications of Direct Variations--Circles 6 | Math Clip Art--Applications of Direct Variations--Circles 6 This is a collection of clip art images that show an application of direction variations in the context of circles. |
Ratios and Rates and Proportions |
|
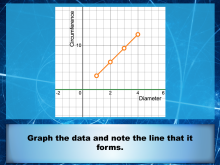
Math Clip Art--Applications of Direct Variations--Circles 7 | Math Clip Art--Applications of Direct Variations--Circles 7 This is a collection of clip art images that show an application of direction variations in the context of circles. |
Ratios and Rates and Proportions |
|
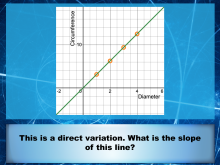
Math Clip Art--Applications of Direct Variations--Circles 8 | Math Clip Art--Applications of Direct Variations--Circles 8 This is a collection of clip art images that show an application of direction variations in the context of circles. |
Ratios and Rates and Proportions |
|
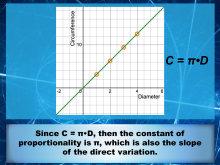
Math Clip Art--Applications of Direct Variations--Circles 9 | Math Clip Art--Applications of Direct Variations--Circles 9 This is a collection of clip art images that show an application of direction variations in the context of circles. |
Ratios and Rates and Proportions |
|
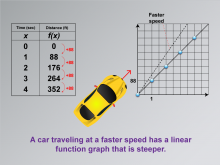
Math Clip Art--Applications of Linear and Quadratic Functions: Speed and Acceleration 01 | Math Clip Art--Applications of Linear and Quadratic Functions: Speed and Acceleration 01TopicQuadratics DescriptionThis image features a vintage car in motion with a blurred background, emphasizing speed. It serves as an introduction to the series on speed and acceleration in linear and quadratic functions. The image visually represents the concept of speed through motion blur, making it relatable for students learning about linear functions. By using this image, teachers can engage students with real-world applications of mathematical concepts. |
Graphs of Linear Functions and Graphs of Quadratic Functions |

|
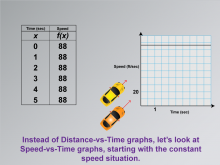
Math Clip Art--Applications of Linear and Quadratic Functions: Speed and Acceleration 02 | Math Clip Art--Applications of Linear and Quadratic Functions: Speed and Acceleration 02TopicQuadratics DescriptionThis image depicts a yellow car alongside a table that shows time in seconds and distance in feet, illustrating a constant speed of 88 ft/sec (60 mph). The table provides a clear example of how linear functions can represent constant speeds. Teachers can use this image to demonstrate the relationship between time, distance, and speed, reinforcing the concept of constant rates within linear functions. |
Graphs of Linear Functions and Graphs of Quadratic Functions |
|
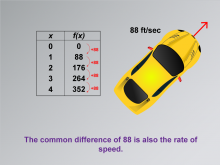
Math Clip Art--Applications of Linear and Quadratic Functions: Speed and Acceleration 03 | Math Clip Art--Applications of Linear and Quadratic Functions: Speed and Acceleration 03TopicQuadratics DescriptionThis image is a variation of the previous image that highlights the common difference as the rate of speed. It builds on the previous example by emphasizing how the common difference (88 ft/sec) serves as the rate in linear equations. This visual representation helps students grasp how mathematical differences translate into real-world speeds. |
Graphs of Linear Functions and Graphs of Quadratic Functions |
|
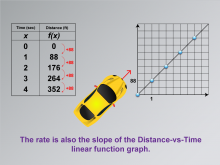
Math Clip Art--Applications of Linear and Quadratic Functions: Speed and Acceleration 04 | Math Clip Art--Applications of Linear and Quadratic Functions: Speed and Acceleration 04TopicQuadratics DescriptionThis image presents a table with time in seconds and distance in feet, accompanied by a graph illustrating a linear relationship between time and distance. The constant increase of 88 feet per second is depicted as the slope of the Distance-vs-Time linear function graph. This visual aids students in understanding how linear functions can model real-world speed scenarios. |
Graphs of Linear Functions and Graphs of Quadratic Functions |
|
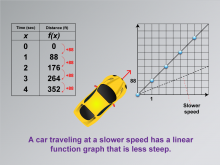
Math Clip Art--Applications of Linear and Quadratic Functions: Speed and Acceleration 05 | Math Clip Art--Applications of Linear and Quadratic Functions: Speed and Acceleration 05TopicQuadratics DescriptionThis image is a variation showing time and distance data with a graph that includes a dotted line labeled "Slower speed." The graph illustrates how different speeds affect the steepness of linear function graphs. This visual comparison helps students see how speed variations are represented mathematically. Using math clip art allows students to visualize differences in speed through graphical representations, aiding comprehension of linear functions' applications. |
Graphs of Linear Functions and Graphs of Quadratic Functions |
|
Math Clip Art--Applications of Linear and Quadratic Functions: Speed and Acceleration 06 | Math Clip Art--Applications of Linear and Quadratic Functions: Speed and Acceleration 06TopicQuadratics DescriptionThis image shows a graph similar to the previous one but with a steeper dotted line labeled "Faster speed." It visually demonstrates how increased speed results in a steeper slope on a linear function graph. This helps students understand the relationship between speed changes and their graphical representations. The use of math clip art facilitates learning by providing clear visual examples that connect mathematical concepts to real-world scenarios. |
Graphs of Linear Functions and Graphs of Quadratic Functions |
|
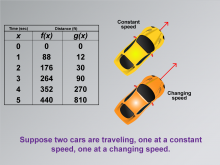
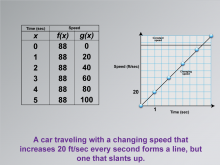
Math Clip Art--Applications of Linear and Quadratic Functions: Speed and Acceleration 07 | Math Clip Art--Applications of Linear and Quadratic Functions: Speed and Acceleration 07TopicQuadratics DescriptionThis image displays a table with time and distance data for two functions, f(x) representing constant speed, and g(x) representing changing speed. Two car icons illustrate these concepts visually. This comparison allows students to explore how different types of motion are modeled mathematically. The use of math clip art aids in understanding complex concepts by providing relatable visual examples that highlight differences in mathematical functions. |
Graphs of Linear Functions and Graphs of Quadratic Functions |
|
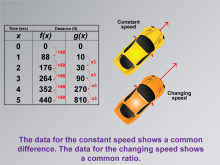
Math Clip Art--Applications of Linear and Quadratic Functions: Speed and Acceleration 08 | Math Clip Art--Applications of Linear and Quadratic Functions: Speed and Acceleration 08TopicQuadratics DescriptionThis image presents time-distance data for functions f(x) with constant increments, showing constant speed, while g(x) shows changing speed with a common ratio. The visual representation helps students understand different mathematical relationships through real-world examples. The use of math clip art enhances comprehension by clearly illustrating abstract concepts like common differences versus common ratios in mathematical functions. |
Graphs of Linear Functions and Graphs of Quadratic Functions |
|
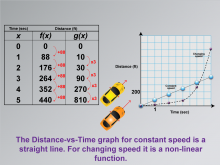
Math Clip Art--Applications of Linear and Quadratic Functions: Speed and Acceleration 09 | Math Clip Art--Applications of Linear and Quadratic Functions: Speed and Acceleration 09TopicQuadratics DescriptionThis image features a graph comparing linear and non-linear functions, illustrating constant and changing speeds. The visual contrast between the two types of functions helps students understand how different speeds are modeled mathematically. The linear function represents constant speed, while the non-linear function shows acceleration or deceleration. Math clip art like this is crucial for teaching because it provides visual clarity, helping students differentiate between linear and quadratic functions in real-world contexts. |
Graphs of Linear Functions and Graphs of Quadratic Functions |
|
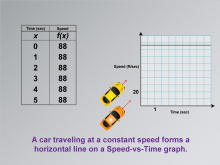
Math Clip Art--Applications of Linear and Quadratic Functions: Speed and Acceleration 10 | Math Clip Art--Applications of Linear and Quadratic Functions: Speed and Acceleration 10TopicQuadratics DescriptionThis image illustrates a constant speed through a graph that shows a straight line, representing uniform motion. It provides an opportunity for students to see how consistent motion is represented visually in a linear function. The consistent slope indicates constant speed, making it easier for students to connect mathematical concepts with practical applications. |
Graphs of Linear Functions and Graphs of Quadratic Functions |
|
Math Clip Art--Applications of Linear and Quadratic Functions: Speed and Acceleration 11 | Math Clip Art--Applications of Linear and Quadratic Functions: Speed and Acceleration 11TopicQuadratics DescriptionThis image shows a graph and data for a constant speed scenario. The graph helps students understand how different speeds are represented in mathematical models, with linear sections indicating constant speed and curved sections showing acceleration or deceleration. Math clip art like this is essential for teaching as it visually differentiates between linear and quadratic functions, providing clarity in understanding real-world applications. |
Graphs of Linear Functions and Graphs of Quadratic Functions |
|
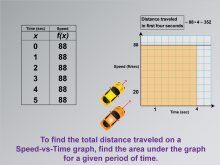
Math Clip Art--Applications of Linear and Quadratic Functions: Speed and Acceleration 12 | Math Clip Art--Applications of Linear and Quadratic Functions: Speed and Acceleration 12TopicQuadratics DescriptionThis image includes a Speed-vs-Time graph with an area under the curve highlighted to represent distance traveled over time. The calculation for distance (88 * 4 = 352) is shown, helping students visualize how to determine total distance using graphs. The use of math clip art enhances learning by providing visual context for abstract concepts like integration in real-world scenarios. Teacher's Script: "See the shaded area? It represents distance. How do we calculate it? Let's find out." |
Graphs of Linear Functions and Graphs of Quadratic Functions |
|
Math Clip Art--Applications of Linear and Quadratic Functions: Speed and Acceleration 13 | Math Clip Art--Applications of Linear and Quadratic Functions: Speed and Acceleration 13TopicQuadratics DescriptionThis image shows a graph displaying two lines: a horizontal line for constant speed and a slanted line for changing speed. It illustrates how different speeds are represented graphically, helping students understand the concept of acceleration. The use of math clip art provides clarity by visually differentiating between constant and changing speeds, aiding comprehension. Teacher's Script: "Look at these lines. How do they show different speeds? Let's explore what these shapes tell us." |
Graphs of Linear Functions and Graphs of Quadratic Functions |
|
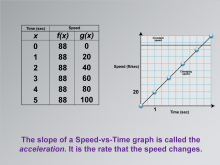
Math Clip Art--Applications of Linear and Quadratic Functions: Speed and Acceleration 14 | Math Clip Art--Applications of Linear and Quadratic Functions: Speed and Acceleration 14TopicQuadratics DescriptionThis image includes a table with time (x) and speed (f(x) and g(x)). The graph shows constant and changing speeds, emphasizing the slope. The slope of a Speed-vs-Time graph is called acceleration, which is the rate that speed changes. The use of math clip art helps students visualize how acceleration is represented graphically, aiding in understanding real-world applications. Teacher's Script: "Notice the slope of these lines. How does it show acceleration? Let's explore what this means for speed changes." |
Graphs of Linear Functions and Graphs of Quadratic Functions |
|
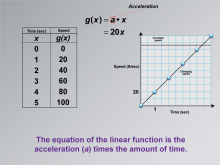
Math Clip Art--Applications of Linear and Quadratic Functions: Speed and Acceleration 15 | Math Clip Art--Applications of Linear and Quadratic Functions: Speed and Acceleration 15TopicQuadratics DescriptionThis image presents a table with time (x) and speed (g(x)). The graph emphasizes acceleration as the slope, with an equation showing g(x) = 20x. The equation of the linear function is the acceleration (a) times the amount of time. The use of math clip art clarifies how equations relate to real-world motion, enhancing comprehension. Teacher's Script: "See how the equation shows acceleration? What does the slope tell us about speed changes?" |
Graphs of Linear Functions and Graphs of Quadratic Functions |
|
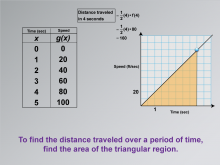
Math Clip Art--Applications of Linear and Quadratic Functions: Speed and Acceleration 16 | Math Clip Art--Applications of Linear and Quadratic Functions: Speed and Acceleration 16TopicQuadratics DescriptionThis image features a table with time versus speed data, along with a graph that explains finding distance by calculating the area under a triangular region. To find the distance traveled over a period, calculate the area of the triangular region. The use of math clip art aids in understanding by connecting theoretical concepts with practical applications. Teacher's Script: "Notice how we find distance using the triangle area. How does this connect to what we've learned about motion?" |
Graphs of Linear Functions and Graphs of Quadratic Functions |
|
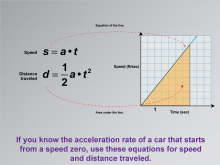
Math Clip Art--Applications of Linear and Quadratic Functions: Speed and Acceleration 17 | Math Clip Art--Applications of Linear and Quadratic Functions: Speed and Acceleration 17TopicQuadratics DescriptionThis image displays a graph with speed versus time, highlighting the equation of the line and the area under it. It emphasizes using these equations when acceleration starts from zero. If you know the acceleration rate of a car that starts from speed zero, use these equations for speed and distance traveled. The use of math clip art provides visual clarity in understanding how equations model motion from rest. Teacher's Script: "Notice these equations—how do they help us understand acceleration from rest?" |
Graphs of Linear Functions and Graphs of Quadratic Functions |
|
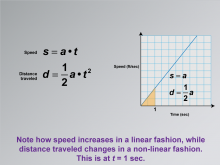
Math Clip Art--Applications of Linear and Quadratic Functions: Speed and Acceleration 18 | Math Clip Art--Applications of Linear and Quadratic Functions: Speed and Acceleration 18TopicQuadratics DescriptionThis image shows a graph with speed on the y-axis and time on the x-axis. The equations for speed and distance traveled are given as s = a⋅t and d = 1/2at2. The graph illustrates how speed increases linearly, while distance traveled follows a non-linear path. Math clip art like this helps students understand the difference between linear and quadratic relationships in real-world contexts. |
Graphs of Linear Functions and Graphs of Quadratic Functions |
|
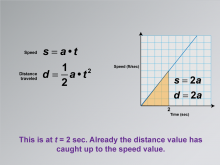
Math Clip Art--Applications of Linear and Quadratic Functions: Speed and Acceleration 19 | Math Clip Art--Applications of Linear and Quadratic Functions: Speed and Acceleration 19TopicQuadratics DescriptionThis image shows a graph similar to the previous image but at t = 2 seconds. The equations are updated to s = 2a and d = 2a, indicating that distance has caught up with speed. The use of math clip art provides visual clarity in understanding dynamic interactions between speed and distance over time. Teacher's Script: "At two seconds, notice how distance catches up to speed. What does this mean for our understanding of motion?" |
Graphs of Linear Functions and Graphs of Quadratic Functions |
|
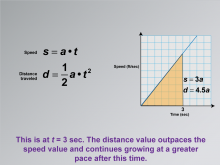
Math Clip Art--Applications of Linear and Quadratic Functions: Speed and Acceleration 20 | Math Clip Art--Applications of Linear and Quadratic Functions: Speed and Acceleration 20TopicQuadratics DescriptionThis image depicts a graph of speed versus time with no initial velocity. The equations shown are s = a⋅t for speed and d = 1/2at2 for distance traveled. At t = 3 seconds, the graph highlights that distance outpaces speed. The use of math clip art helps students visualize how distance can grow faster than speed under certain conditions. Teacher's Script: "At three seconds, see how distance outpaces speed? Let's explore why this happens." |
Graphs of Linear Functions and Graphs of Quadratic Functions |
|
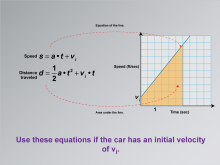
Math Clip Art--Applications of Linear and Quadratic Functions: Speed and Acceleration 21 | Math Clip Art--Applications of Linear and Quadratic Functions: Speed and Acceleration 21TopicQuadratics DescriptionThis image shows a graph with a line representing speed as a function of time, with initial velocity. The equations for speed are s = a⋅t+vi and for distance traveled are d= 1/2at2 +vi •t. The graph illustrates the area under the line, indicating distance. The use of math clip art provides students with visual tools to understand how initial velocity affects motion over time. Teacher's Script: "Notice how initial velocity changes the graph. How does this affect our calculations for distance?" |
Graphs of Linear Functions and Graphs of Quadratic Functions |
|
Math Clip Art--Applications of Linear Functions--Business Model 1 | Math Clip Art--Applications of Linear Functions--Business Model 1TopicLinear Functions DescriptionIn this series of math clip art demonstrating applications of linear functions, the business model series offers insight into real-world uses of linear equations. This specific image serves as an introduction, presenting the title "Applications of Linear Functions: Building a Business Model." |
Applications of Linear Functions |

|
Math Clip Art--Applications of Linear Functions--Business Model 2 | Math Clip Art--Applications of Linear Functions--Business Model 2TopicLinear Functions DescriptionThis math clip art is part of a series illustrating applications of linear functions in business modeling. The image focuses on the production cost of t-shirts, highlighting that each t-shirt costs $10 to produce, including materials and labor. |
Applications of Linear Functions |

|
Math Clip Art--Applications of Linear Functions--Business Model 3 | Math Clip Art--Applications of Linear Functions--Business Model 3TopicLinear Functions DescriptionThis math clip art continues the series on applications of linear functions in business modeling. The image depicts a sewing machine with t-shirts, introducing the concept of fixed monthly costs in a business, set at $2000 for expenses like rent and utilities. |
Applications of Linear Functions |
|
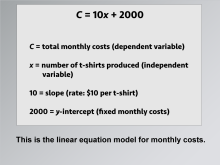
Math Clip Art--Applications of Linear Functions--Business Model 4 | Math Clip Art--Applications of Linear Functions--Business Model 4TopicLinear Functions DescriptionThis math clip art is a crucial part of the series on applications of linear functions in business modeling. It presents the equation C = 10x + 2000, which encapsulates the business model we've been building. Here, C represents the total monthly costs, x is the number of t-shirts produced, 10 is the cost per shirt, and 2000 represents the fixed monthly costs. |
Applications of Linear Functions |
|
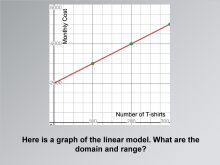
Math Clip Art--Applications of Linear Functions--Business Model 5 | Math Clip Art--Applications of Linear Functions--Business Model 5TopicLinear Functions DescriptionThis math clip art continues the series on applications of linear functions in business modeling. It presents a graph of the linear function for cost that we've been developing throughout this series. The image prompts students to consider the domain and range of this function within the context of the t-shirt business. |
Applications of Linear Functions |
|
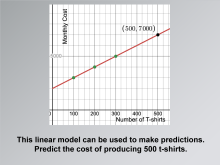
Math Clip Art--Applications of Linear Functions--Business Model 6 | Math Clip Art--Applications of Linear Functions--Business Model 6TopicLinear Functions DescriptionThis math clip art is part of a series demonstrating applications of linear functions in business modeling. The image shows a graph of the linear model we've developed, emphasizing its predictive power. It challenges students to use the model to predict the cost of producing 500 t-shirts. |
Applications of Linear Functions |
|
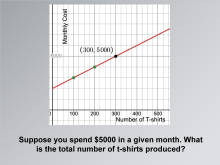
Math Clip Art--Applications of Linear Functions--Business Model 7 | Math Clip Art--Applications of Linear Functions--Business Model 7TopicLinear Functions DescriptionThis math clip art continues the series on applications of linear functions in business modeling. The image presents a graph and poses a question about determining the number of t-shirts produced given a total monthly expenditure of $5000. This scenario demonstrates how linear models can be used to solve for unknown variables. |
Applications of Linear Functions |
|
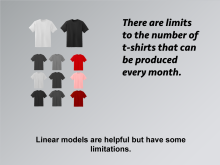
Math Clip Art--Applications of Linear Functions--Business Model 8 | Math Clip Art--Applications of Linear Functions--Business Model 8TopicLinear Functions DescriptionThis math clip art is part of a series illustrating applications of linear functions in business modeling. The image depicts t-shirts with a caption that introduces the concept of limitations in linear models. This encourages critical thinking about the applicability and constraints of mathematical models in real-world scenarios. |
Applications of Linear Functions |
|
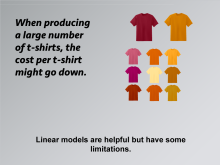
Math Clip Art--Applications of Linear Functions--Business Model 9 | Math Clip Art--Applications of Linear Functions--Business Model 9TopicLinear Functions DescriptionThis math clip art concludes the series on applications of linear functions in business modeling. The image reiterates the limitations of linear models and introduces a specific example: the possibility of reduced per-unit costs when producing large quantities of t-shirts. This concept challenges the assumption of constant per-unit costs in our linear model. |
Applications of Linear Functions |

|
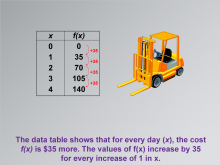
Math Clip Art--Applications of Linear Functions: Cost vs. Time 01 | Math Clip Art--Applications of Linear Functions: Cost vs. Time 01TopicLinear Functions |
Graphs of Linear Functions and Slope-Intercept Form |
|
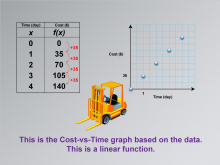
Math Clip Art--Applications of Linear Functions: Cost vs. Time 02 | Math Clip Art--Applications of Linear Functions: Cost vs. Time 02TopicLinear Functions |
Graphs of Linear Functions and Slope-Intercept Form |
|
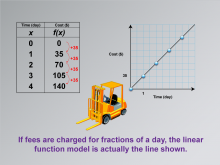
Math Clip Art--Applications of Linear Functions: Cost vs. Time 03 | Math Clip Art--Applications of Linear Functions: Cost vs. Time 03TopicLinear Functions |
Graphs of Linear Functions and Slope-Intercept Form |
|
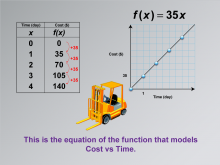
Math Clip Art--Applications of Linear Functions: Cost vs. Time 04 | Math Clip Art--Applications of Linear Functions: Cost vs. Time 04TopicLinear Functions |
Graphs of Linear Functions and Slope-Intercept Form |
|
Math Clip Art--Applications of Linear Functions: Cost vs. Time 05 | Math Clip Art--Applications of Linear Functions: Cost vs. Time 05TopicLinear Functions |
Graphs of Linear Functions and Slope-Intercept Form |
|
Math Clip Art--Applications of Linear Functions: Cost vs. Time 06 | Math Clip Art--Applications of Linear Functions: Cost vs. Time 06TopicLinear Functions |
Graphs of Linear Functions and Slope-Intercept Form |
|
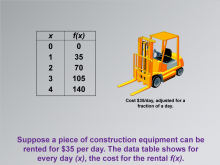
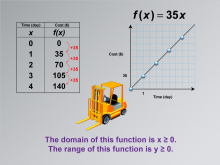
Math Clip Art--Applications of Linear Functions: Cost vs. Time 07 | Math Clip Art--Applications of Linear Functions: Cost vs. Time 07TopicLinear Functions DescriptionThis math clip art image is the seventh in a series dedicated to illustrating applications of linear functions, specifically focusing on building a linear function model for equipment rental costs. The image builds upon the previous one by introducing the concepts of domain and range in the context of the rental cost function. It continues to feature the construction equipment scenario, emphasizing the practical constraints on the function's input and output values. |
Graphs of Linear Functions and Slope-Intercept Form |
|
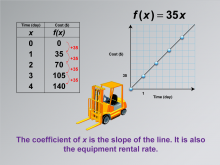
Math Clip Art--Applications of Linear Functions: Cost vs. Time 08 | Math Clip Art--Applications of Linear Functions: Cost vs. Time 08TopicLinear Functions DescriptionThis math clip art image is the eighth in a series exploring applications of linear functions, focusing on building a linear function model for equipment rental costs. The image emphasizes the relationship between the coefficient of x in the linear equation, the slope of the line in the graph, and the real-world rental rate. It continues to feature the construction equipment scenario, providing a concrete context for understanding these mathematical concepts. |
Graphs of Linear Functions and Slope-Intercept Form |
|
Math Clip Art--Applications of Linear Functions: Cost vs. Time 09 | Math Clip Art--Applications of Linear Functions: Cost vs. Time 09TopicLinear Functions |
Graphs of Linear Functions and Slope-Intercept Form |
|
Math Clip Art--Applications of Linear Functions: Cost vs. Time 10 | Math Clip Art--Applications of Linear Functions: Cost vs. Time 10TopicLinear Functions |
Graphs of Linear Functions and Slope-Intercept Form |
|
Math Clip Art--Applications of Linear Functions: Cricket Chirps 01 | Math Clip Art--Applications of Linear Functions: Cricket Chirps 01TopicLinear Functions DescriptionThis image introduces the topic Applications of Linear Functions: Cricket Chirps and sets the stage for understanding the relationship between the number of cricket chirps and outside temperature. It serves as a title card for a series of images exploring how linear functions can model real-world scenarios, specifically the connection between cricket chirps and outdoor temperature. |
Graphs of Linear Functions and Slope-Intercept Form |
|
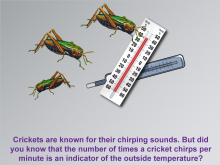
Math Clip Art--Applications of Linear Functions: Cricket Chirps 02 | Math Clip Art--Applications of Linear Functions: Cricket Chirps 02TopicLinear Functions DescriptionThis image in the series on applications of linear functions introduces the concept of crickets as nature's thermometers. It visually represents how the frequency of cricket chirps can indicate outside temperature, setting the foundation for exploring the linear relationship between these variables. |
Graphs of Linear Functions and Slope-Intercept Form |
|
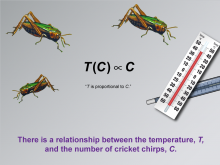
Math Clip Art--Applications of Linear Functions: Cricket Chirps 03 | Math Clip Art--Applications of Linear Functions: Cricket Chirps 03TopicLinear Functions DescriptionThis image in the series on applications of linear functions illustrates the direct relationship between temperature (T) and the number of cricket chirps (C). It visually represents how these two variables are connected, laying the groundwork for developing a linear function model. |
Graphs of Linear Functions and Slope-Intercept Form |
|
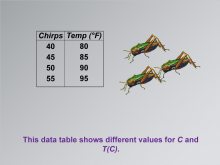
Math Clip Art--Applications of Linear Functions: Cricket Chirps 04 | Math Clip Art--Applications of Linear Functions: Cricket Chirps 04TopicLinear Functions DescriptionThis image presents a data table showing different values for cricket chirps (C) and corresponding temperatures (T). It's a crucial step in building a linear function model, as it provides the raw data from which the relationship will be derived. |
Graphs of Linear Functions and Slope-Intercept Form |
|
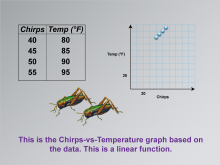
Math Clip Art--Applications of Linear Functions: Cricket Chirps 05 | Math Clip Art--Applications of Linear Functions: Cricket Chirps 05TopicLinear Functions DescriptionThis image in the series on applications of linear functions presents a graph of the chirps-vs-temperature data. It shows discrete points plotted on a coordinate plane, demonstrating the linear relationship between cricket chirps and temperature. |
Graphs of Linear Functions and Slope-Intercept Form |
|
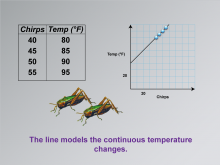
Math Clip Art--Applications of Linear Functions: Cricket Chirps 06 | Math Clip Art--Applications of Linear Functions: Cricket Chirps 06TopicLinear Functions DescriptionThis image builds upon the previous one in the series on applications of linear functions. It shows the same data points as before, but now connected by a straight line. This line represents the continuous relationship between cricket chirps and temperature. |
Graphs of Linear Functions and Slope-Intercept Form |